Iris Customization Enhancements


As we prepare for new capabilities within the Iris platform, we’re laying the groundwork for some big changes. To that end, we’re introducing some foundational changes in this release, including a new settings panel that will help us support additional functionality and customization. Although some of your customization options may have moved, we’re working to centralize your control over your Iris workflow and enable even more options in the coming months as we continue to improve our tools to better support a safer internet.
The Settings Panel
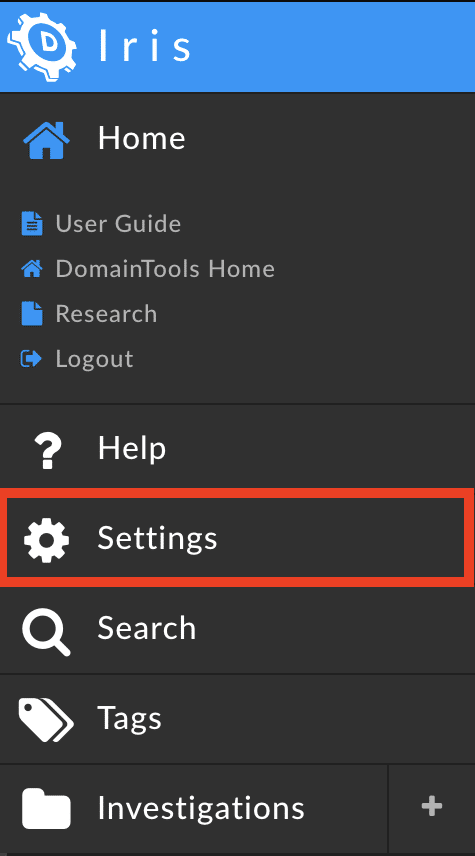
You can find the new Settings panel in the lefthand menu underneath the Help section.
In the Settings panel, you can now
- Control your Theme by selecting between Bright Mode and Dark Mode

- Customize your Arrival Experience by selecting whether to display the Inspector view in the Iris arrival experience

- Manage tag delete confirmation message settings, enabling a confirmation to appear before deleting tags from domains

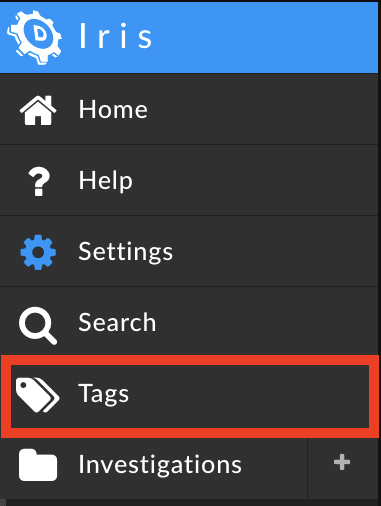
- Note that robust tag management, including the ability to create new tags, edit tags, add descriptions, or delete tags can be found by selecting Tags from the lefthand menu to open the Tags panel
- Note that robust tag management, including the ability to create new tags, edit tags, add descriptions, or delete tags can be found by selecting Tags from the lefthand menu to open the Tags panel
- Select your Search Panel Layout to customize what you see when you first perform a search; select from the available options or customize your own layout from the search view or from the Search section
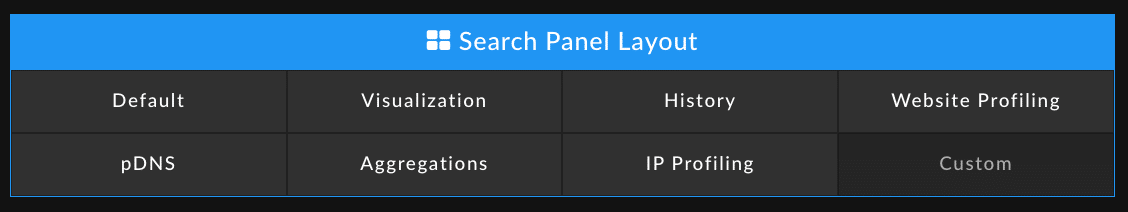
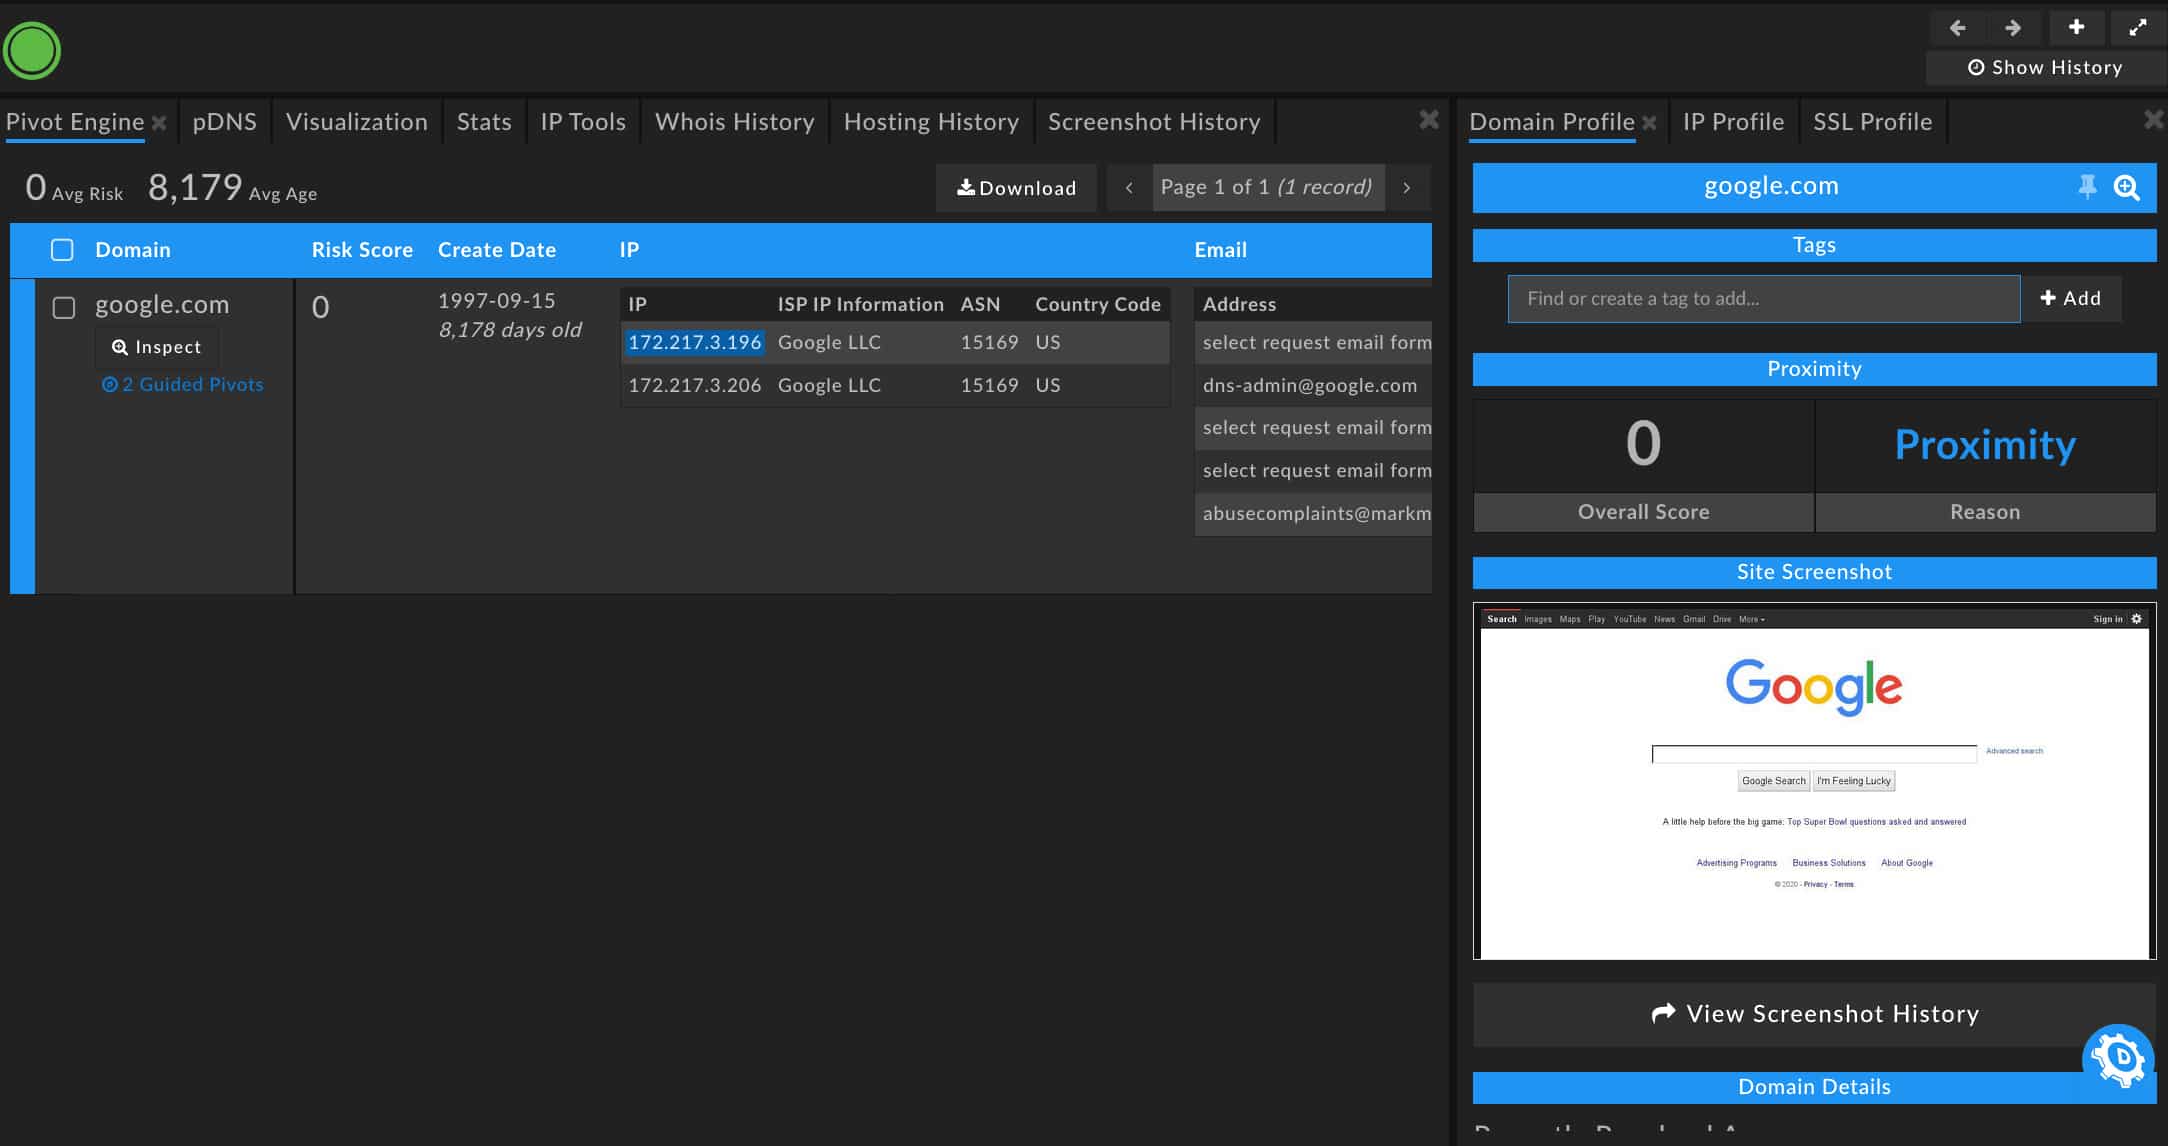
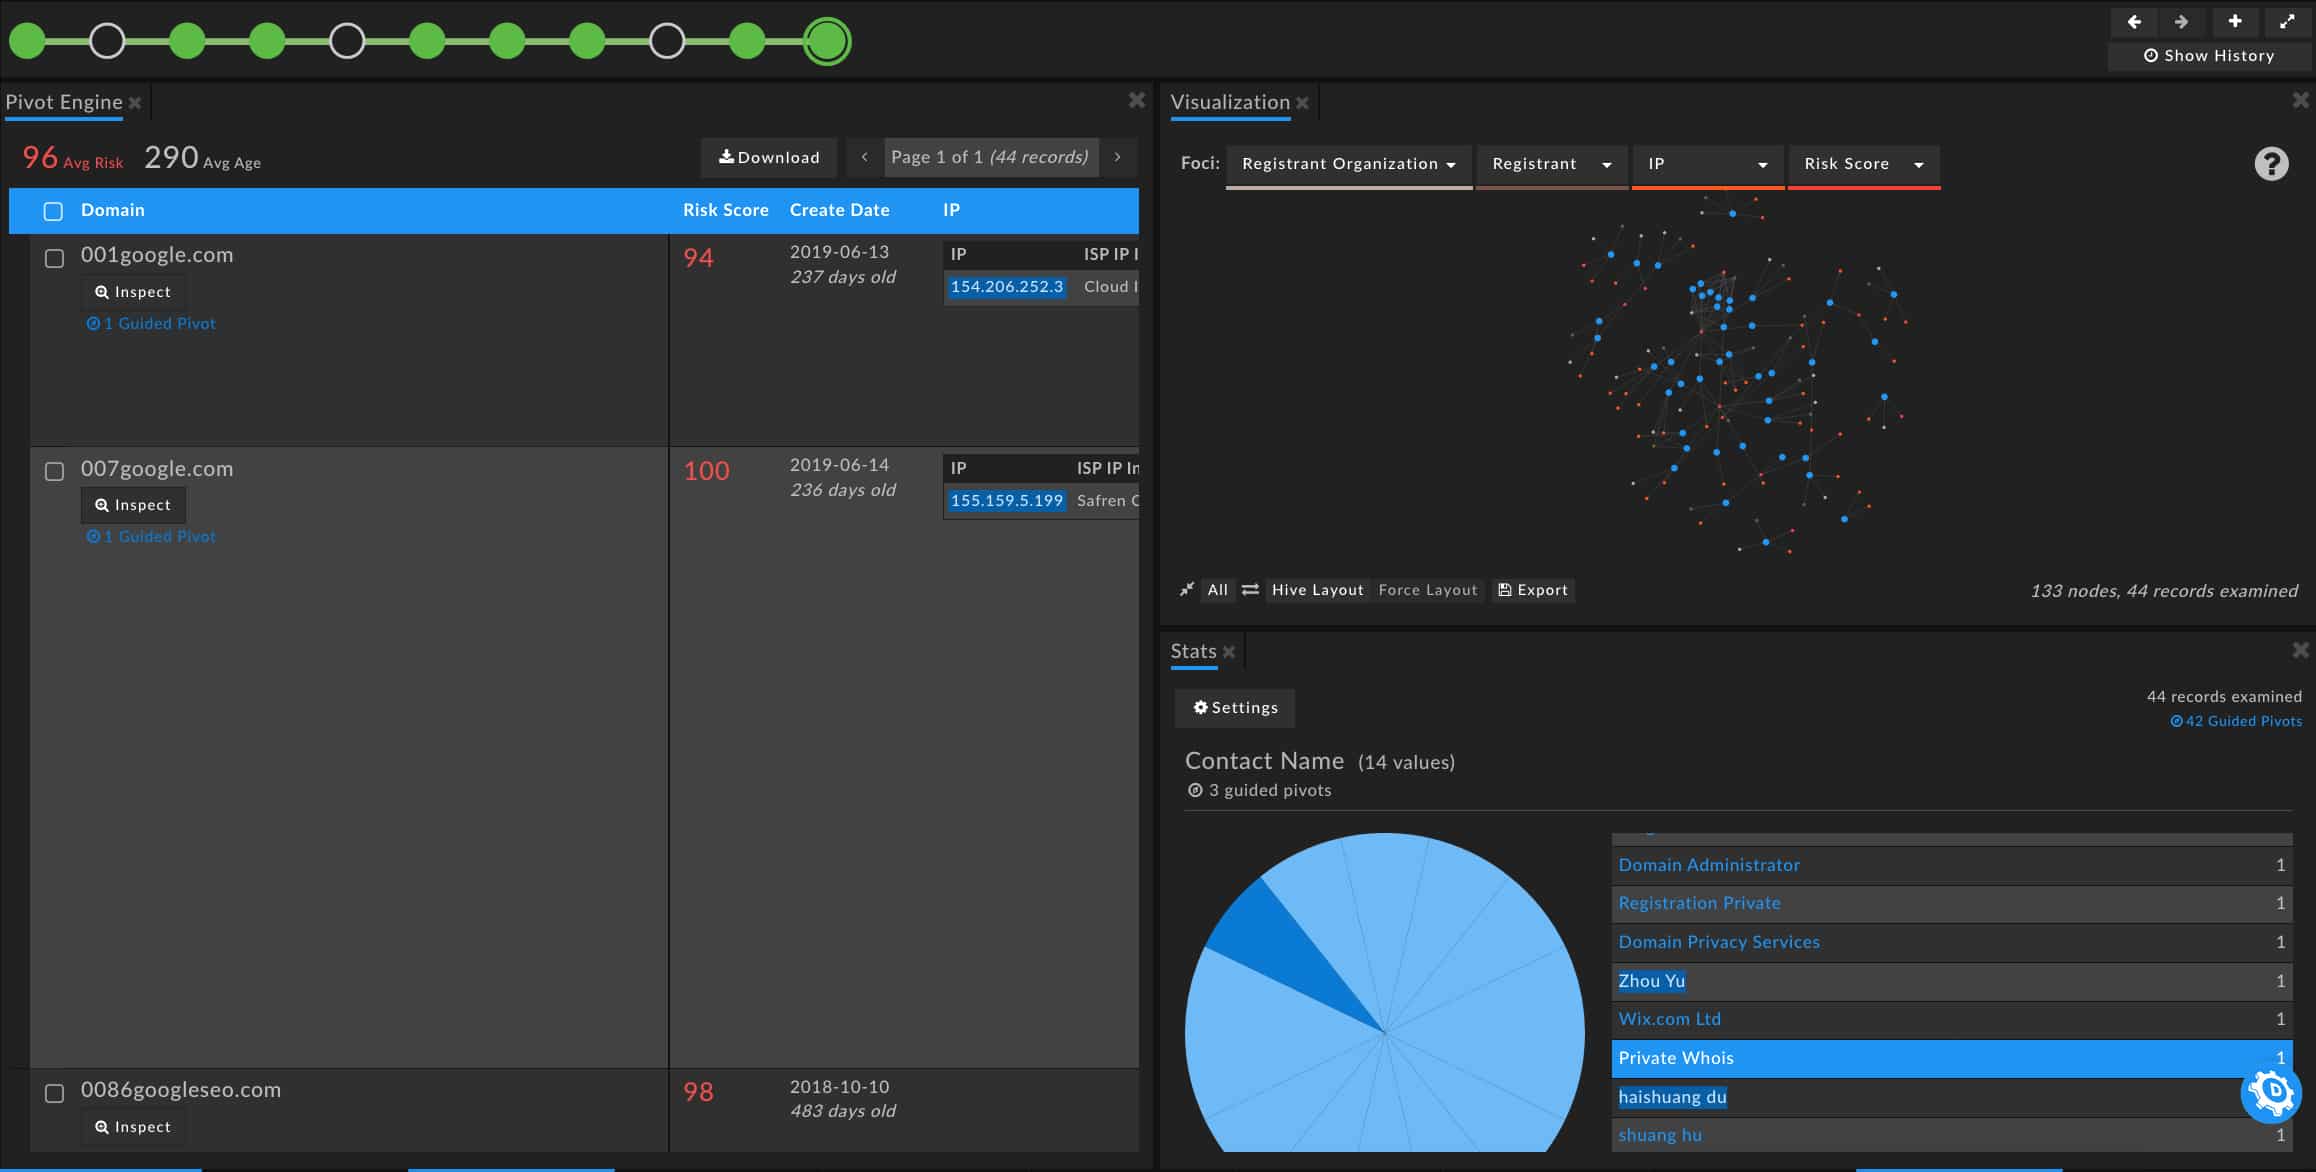
- Default view, highlighting the Pivot Engine and the Domain Profile with risk scores and screenshots
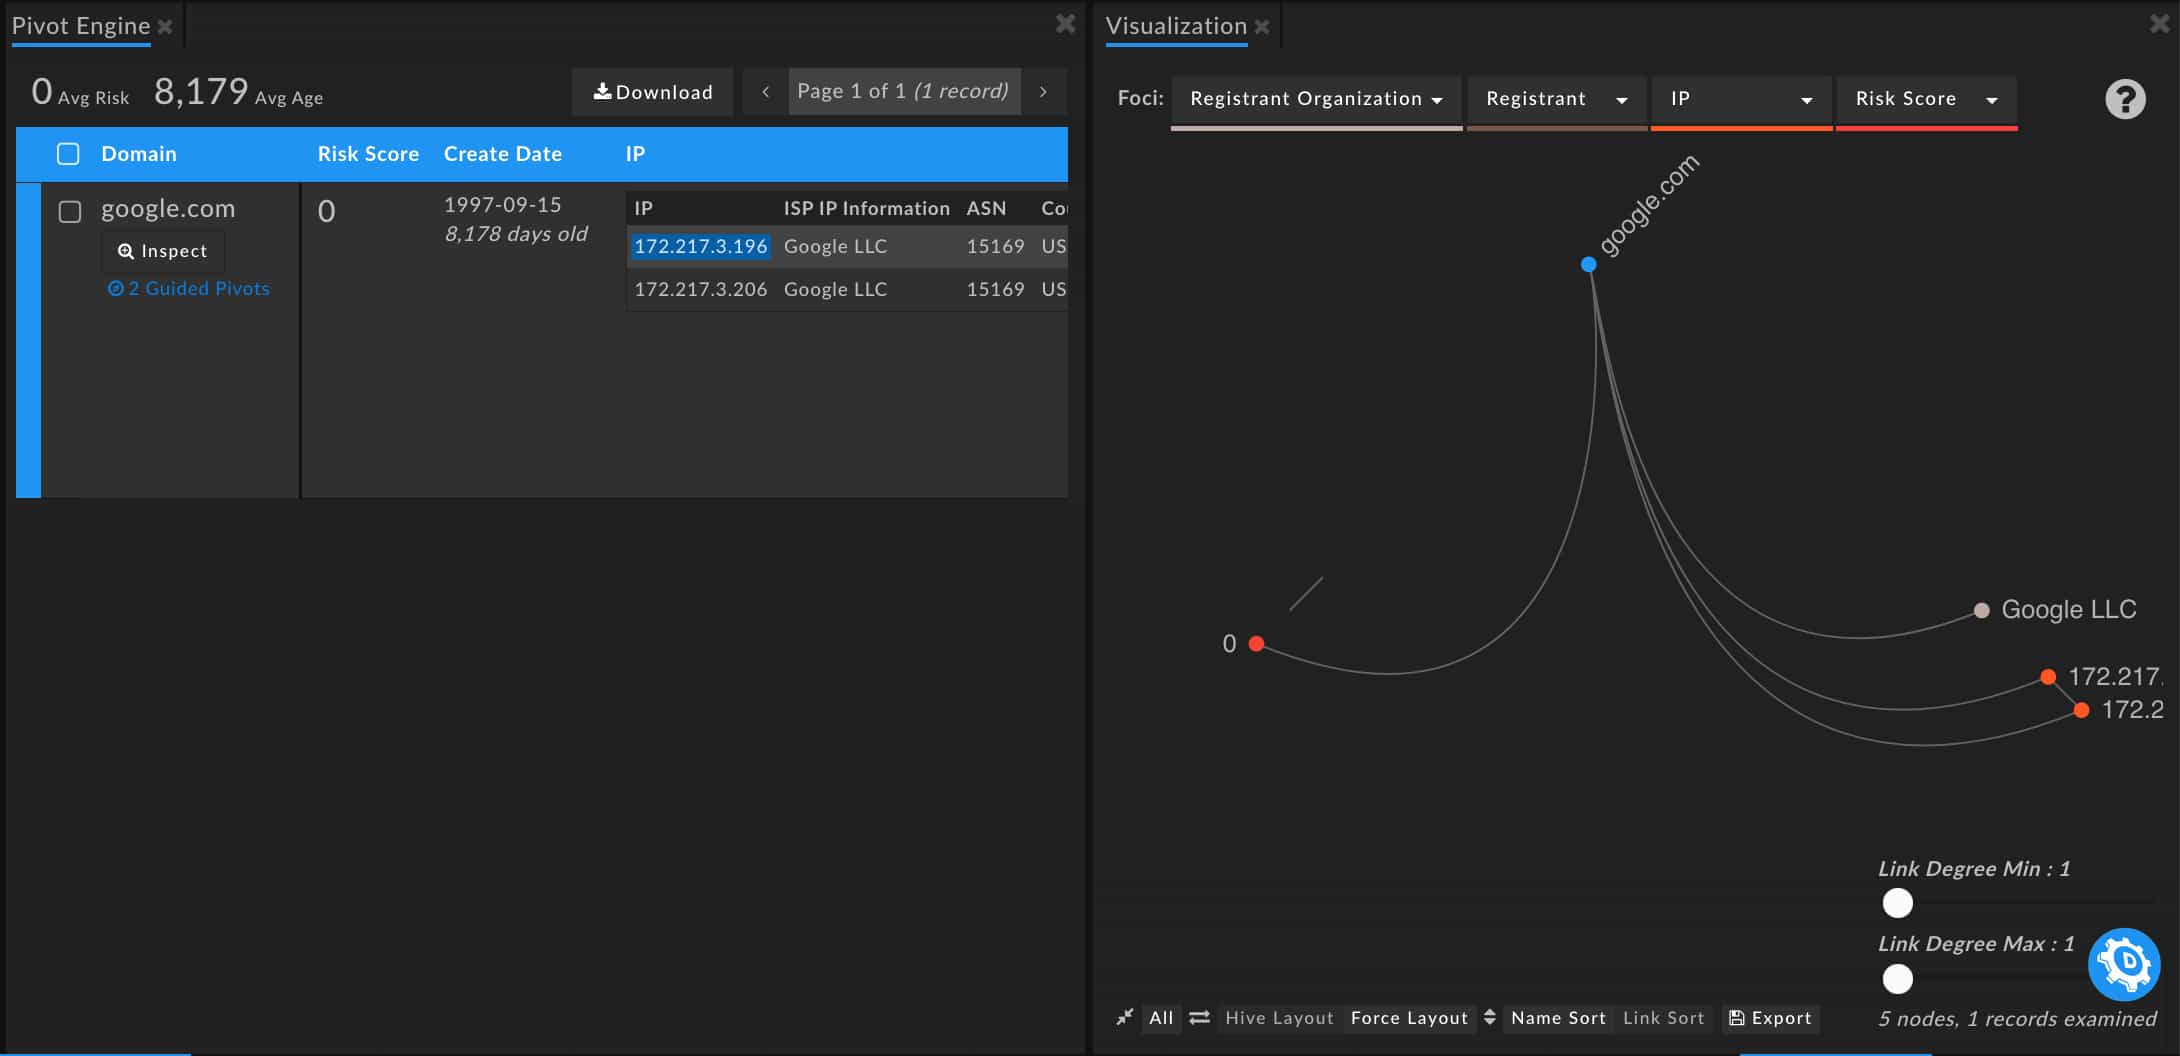
- Visualization view, illustrating pivots and connections via nodal representations
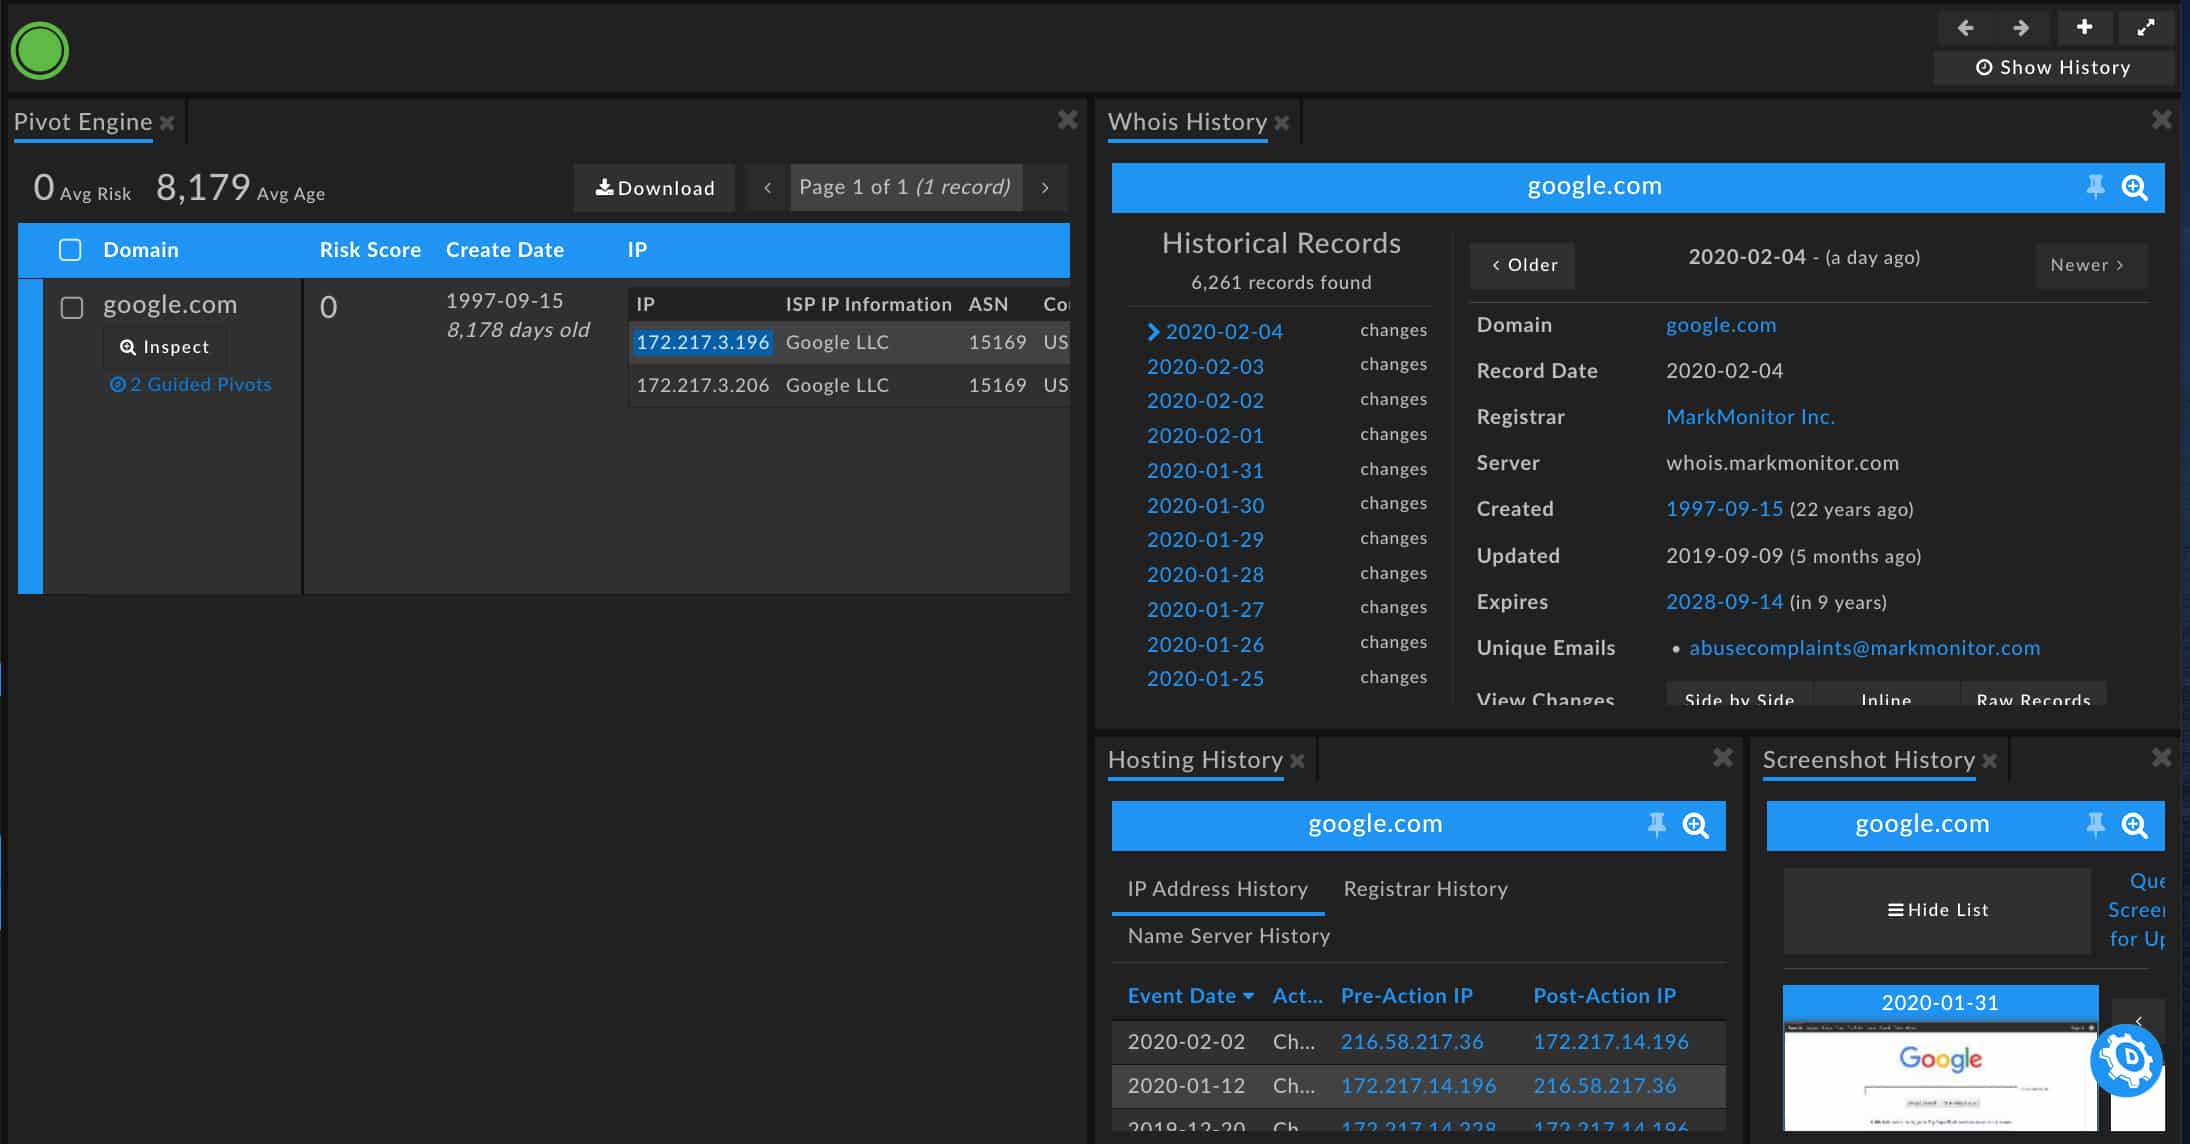
- History view, highlighting historical details about a WhoIs History, Hosting History, and Screenshot History
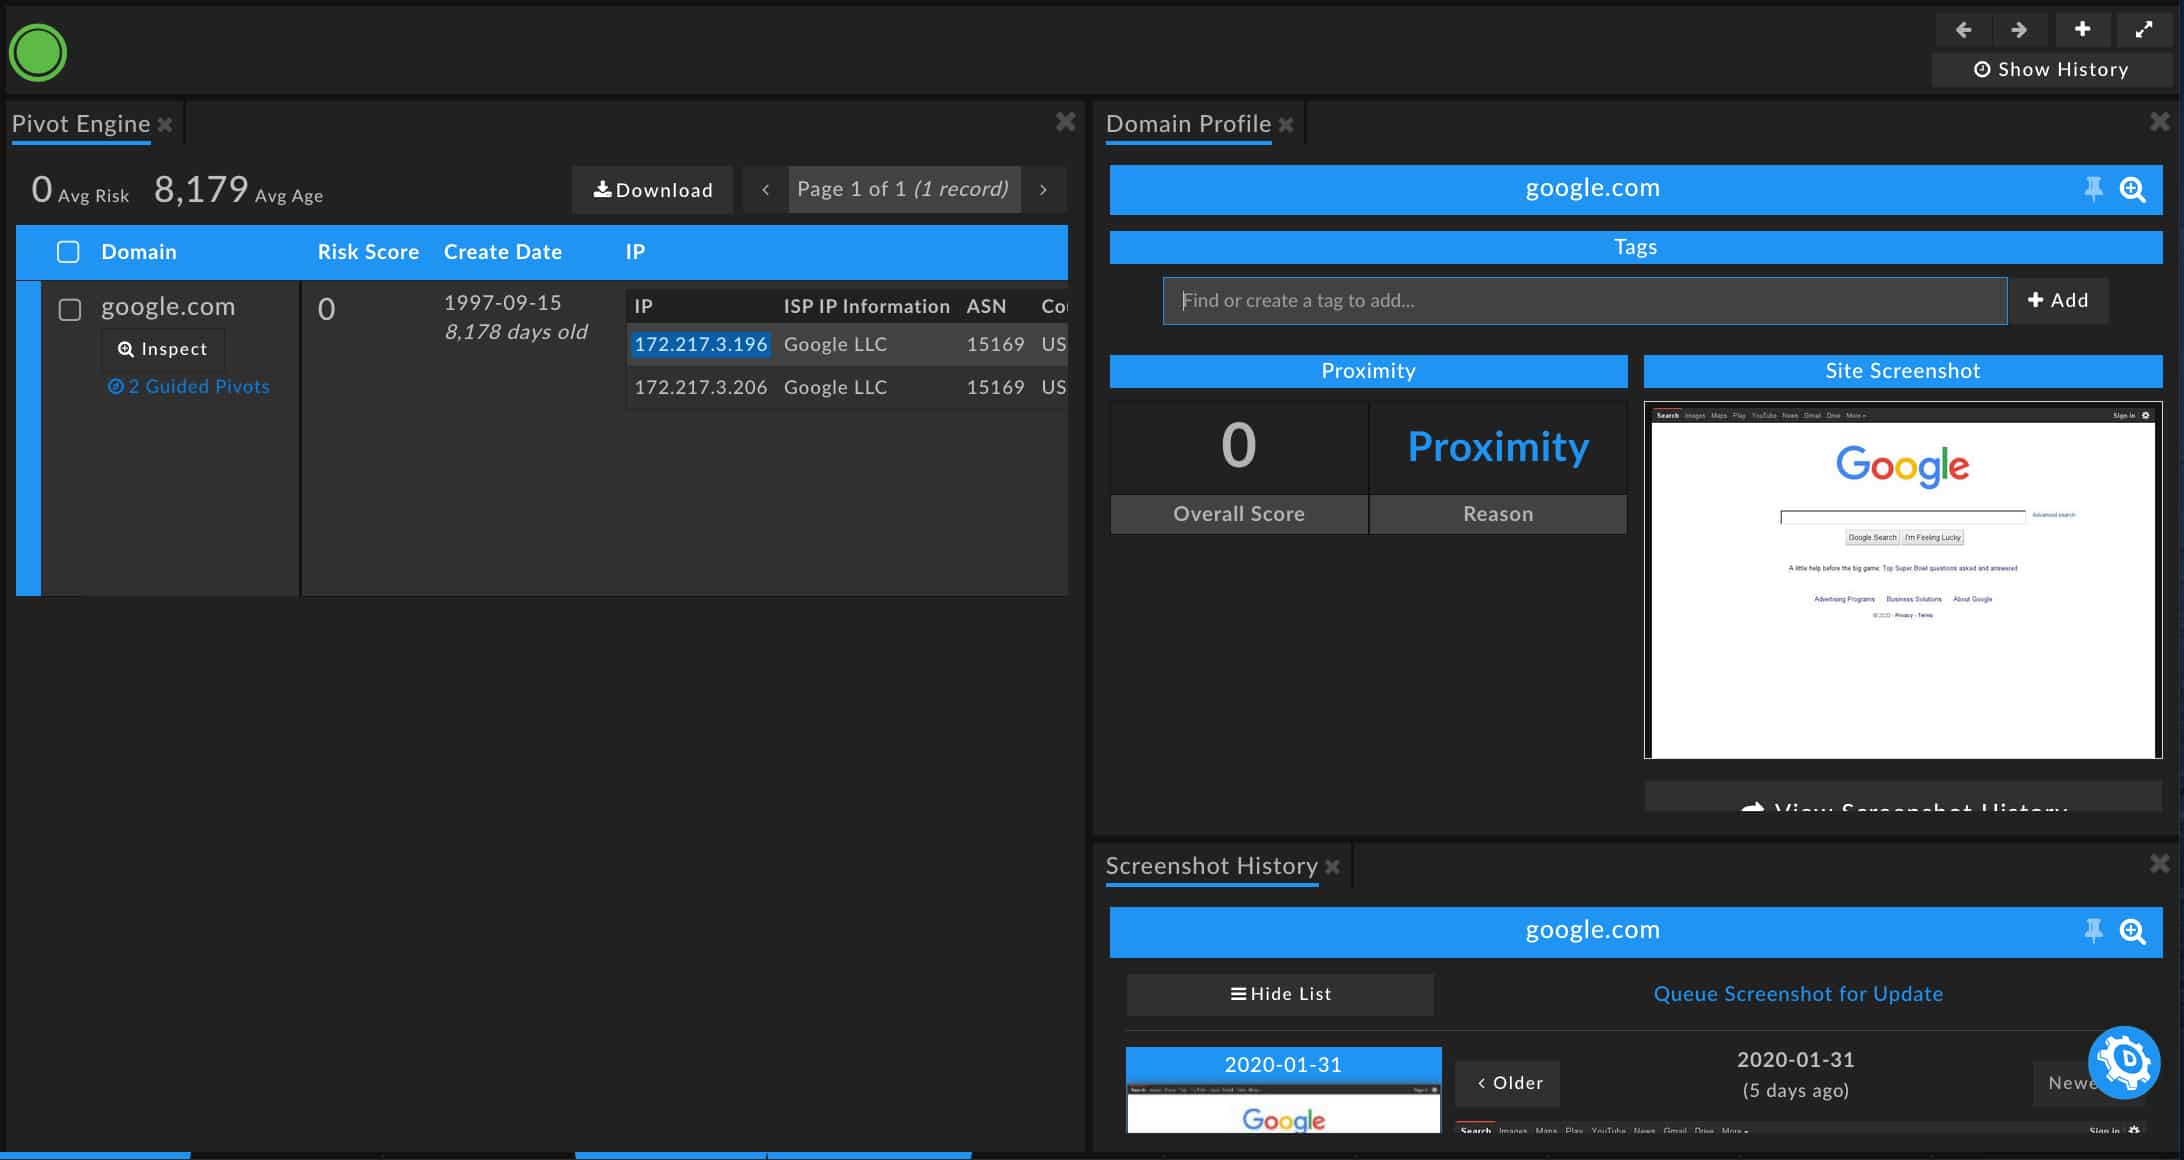
- Website Profiling view, showing Domain Profile and Screenshot History
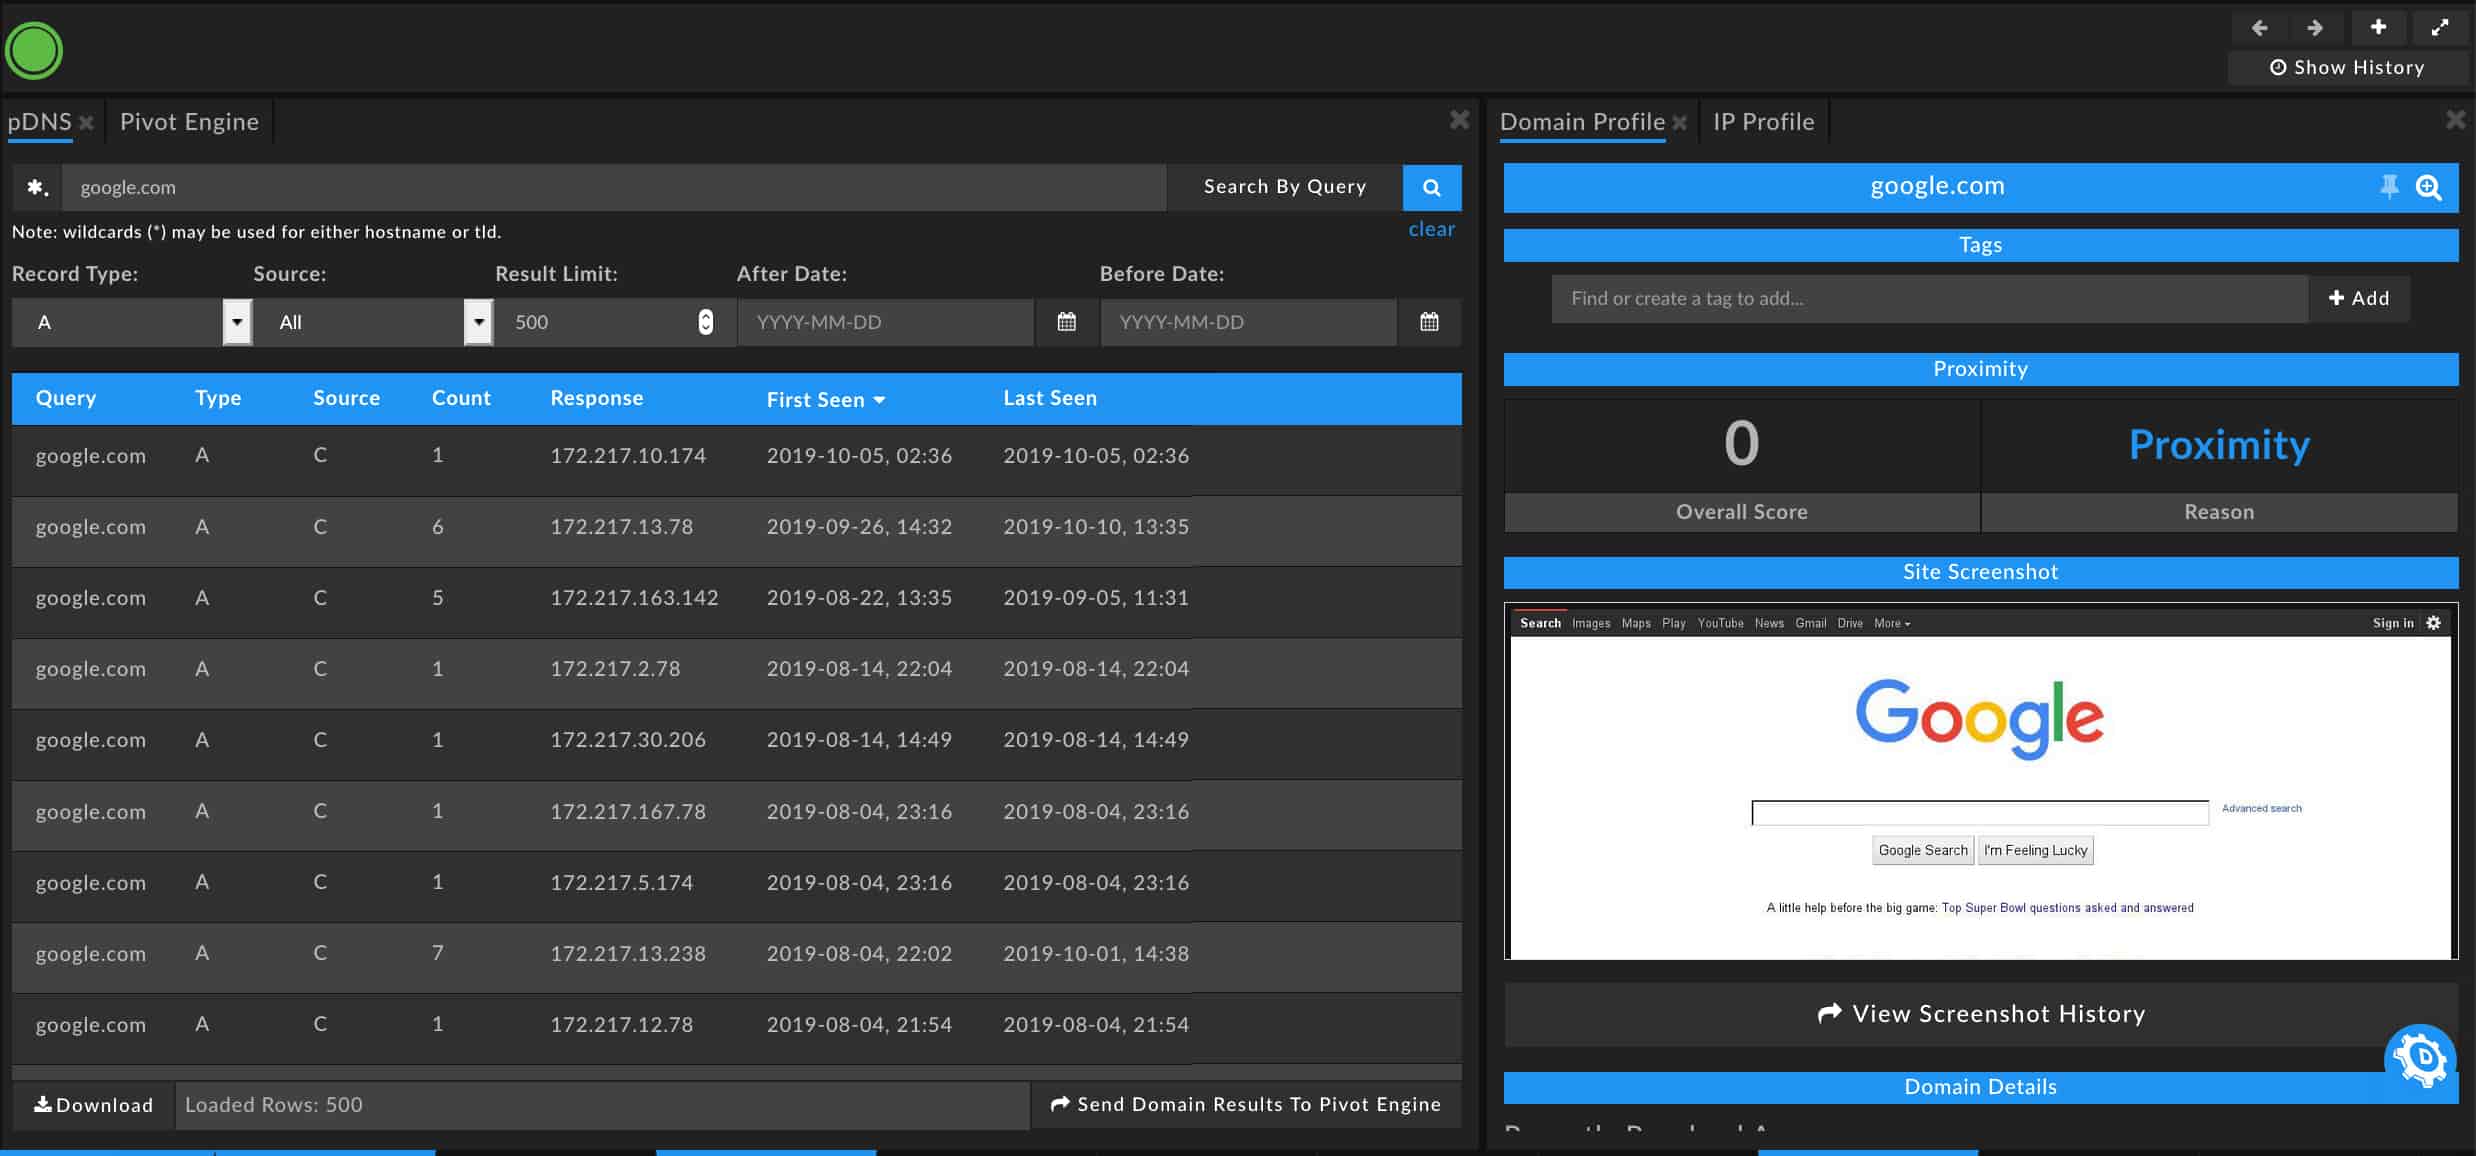
- pDNS view, presenting DNS resolution data to better identify domain and subdomain connections and activity as well as the Domain Profile pane
- Aggregations view, displaying both the Stats pane and Visualization pane to help elucidate patterns and connections
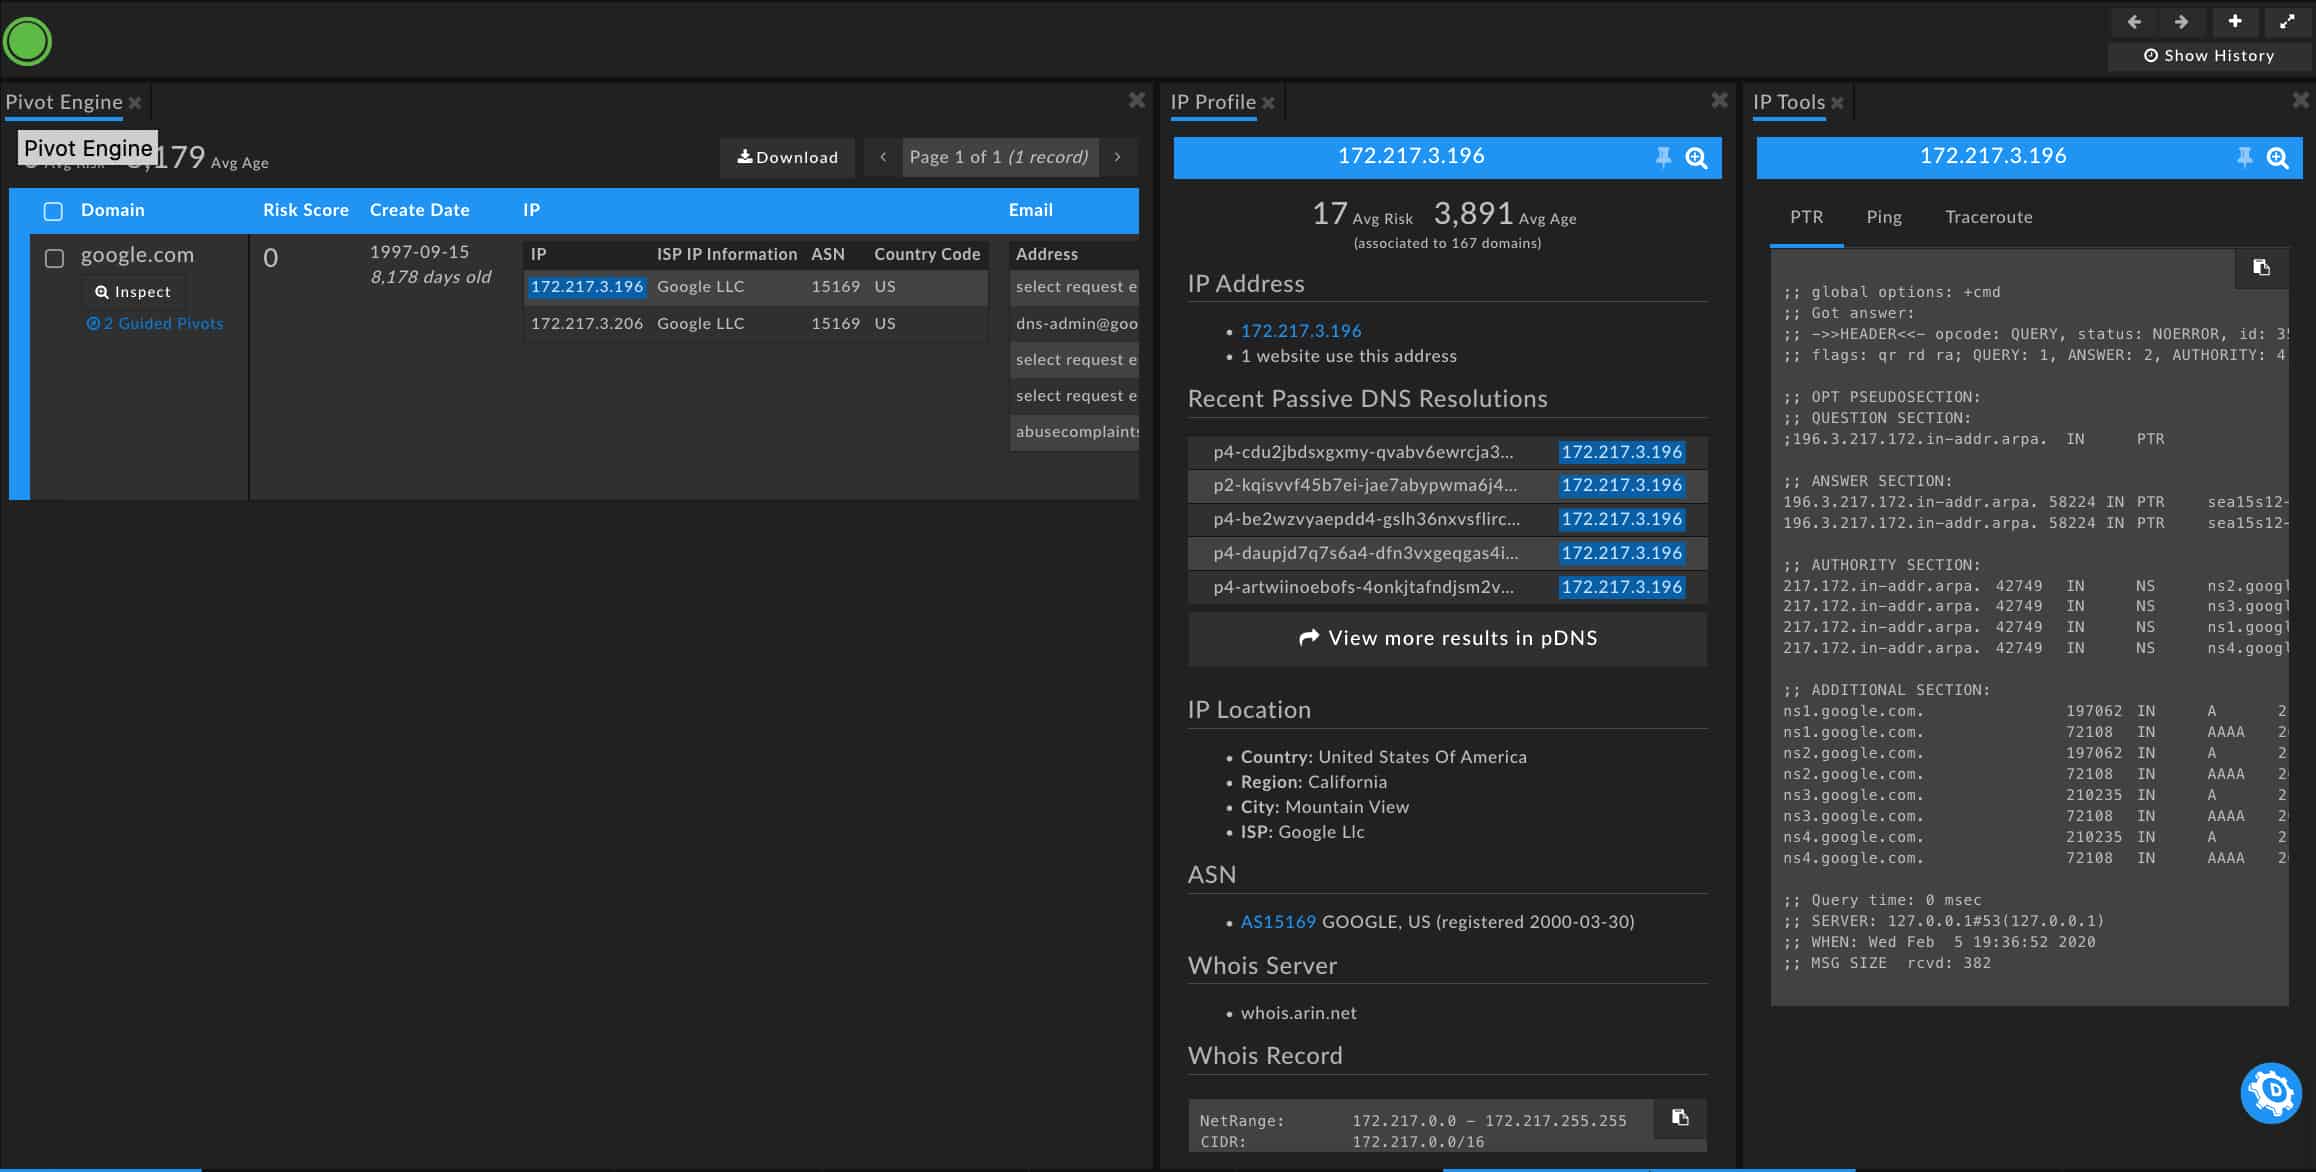
- IP Profiling view, detailing IP information and connections
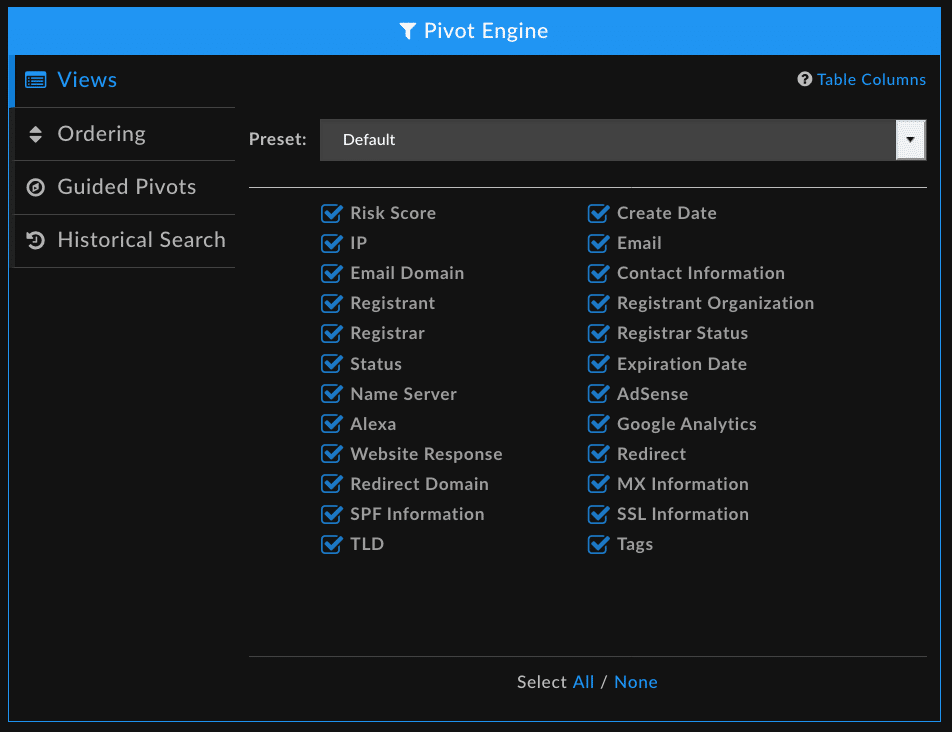
- Personalize your Pivot Engine view with Pivot Engine settings customization
- Select the columns that are displayed or hidden
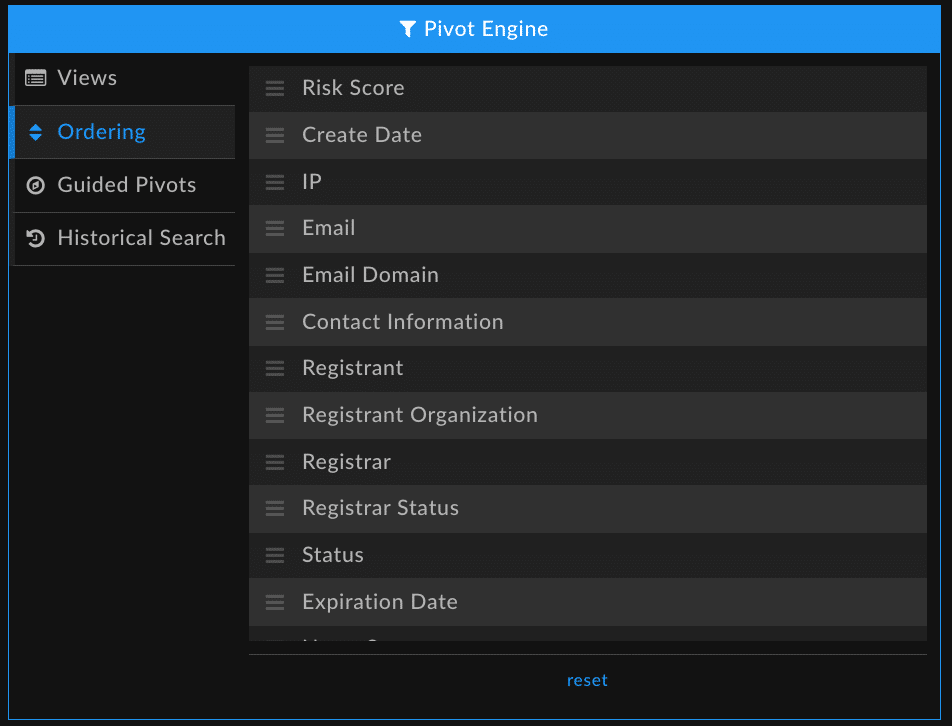
- Reorder the columns to best support your investigation methods
- Establish custom thresholds for guided pivot counts
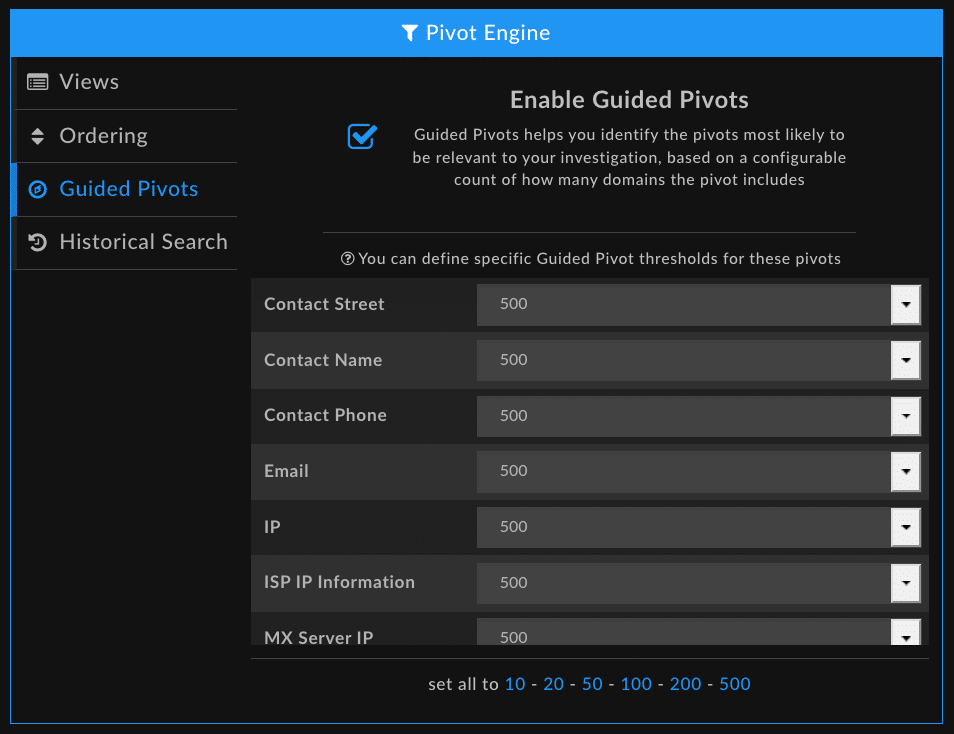
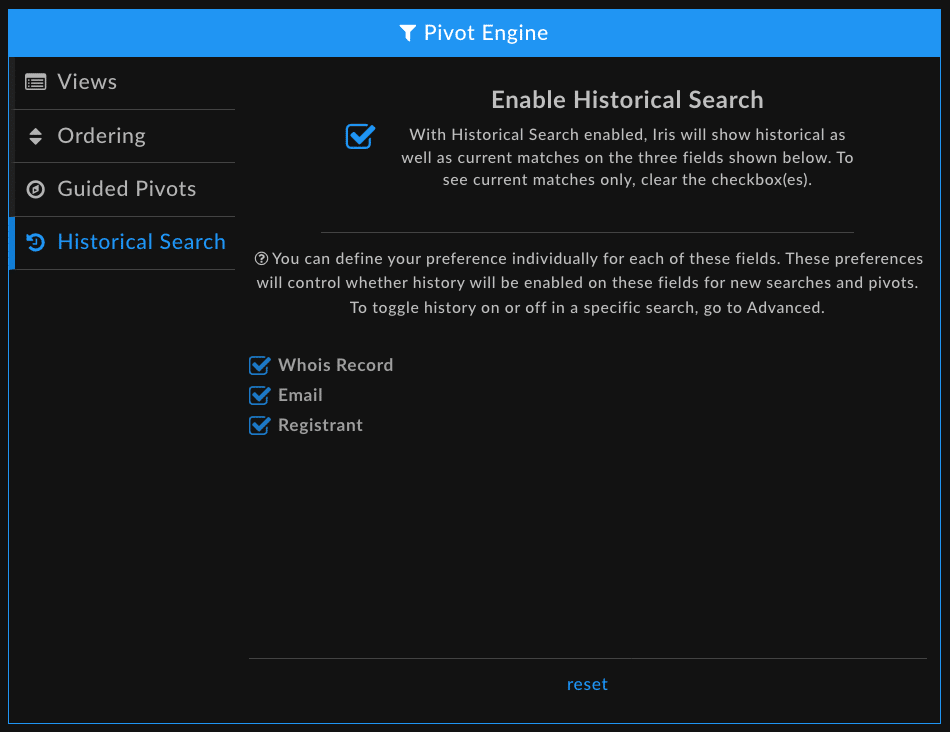
- Set preferences for the inclusion of historical data in your search results
- Tailor the Stats pane to show the aggregated data you need to help guide pattern detection
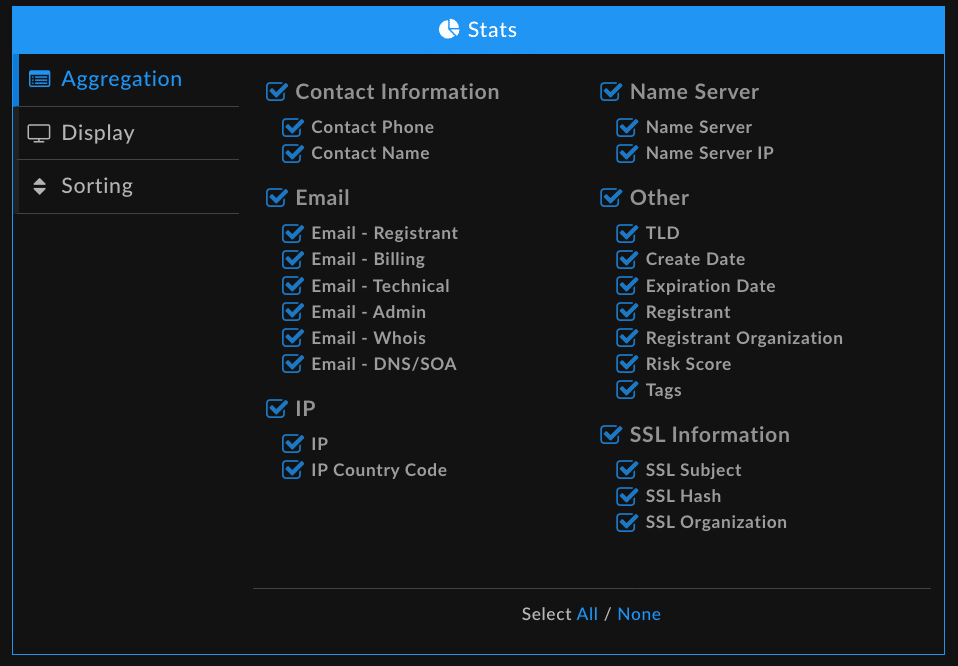
-
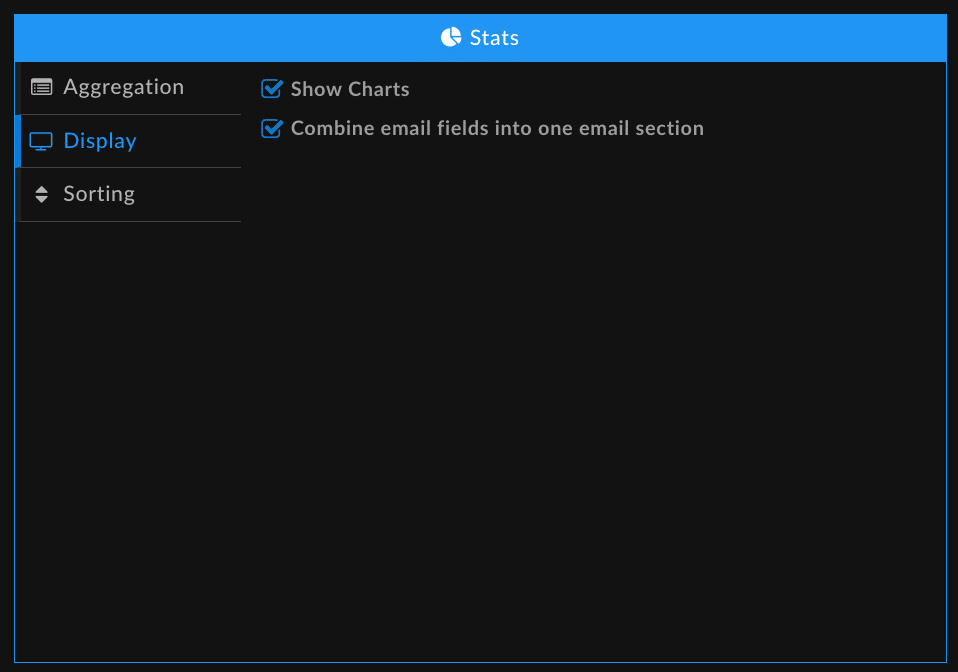
- Select how you want to see visualizations
- Sort your results
- Reset your preferences to default settings by scrolling down to the bottom of the page and selecting Reset Saved Preferences

Additional Changes
In this release, we’ve also
- Fixed bugs related to multi-select and hotkey functionality
- Addressed display issues in the Pivot Engine, Domain Profile, and Inspect views
- Made changes to improve Search Results returns for Google Analytics Codes
Looking to the Future
While these changes may feel small, they lay the groundwork for exciting new capabilities and features to come. We hope to bring you even more ways to identify threats and map threat actor activity, so stay tuned for ongoing improvements, and, for now, happy hunting!