The DomainTools Report, Spring 2023


It’s that time again—a new edition of the DomainTools Report! Since the first DomainTools Report in 2015, we have sought to explore our stores of domain registration, hosting, and content-related data to surface patterns and trends that might be of interest to security practitioners, researchers, and anyone else interested in the suspicious or malicious use of online infrastructure.
In this edition, we again focus on concentrations of malicious activity by the same six features we studied in the last edition in the Fall of 2021:
- Top Level Domain (TLD); for example, .com or .net
- IP Autonomous System Number (ASN); these represent an aspect of the domain’s hosting
- Nameserver ASN; these represent the hosting of the nameserver associated with a domain
- IP Geolocation: the country code associated with the location of the domain’s IP address
- Registrar: the entity through which the domain was registered
- SSL Certificate Authority (CA): the CA for certificate(s) associated with domains
We chose these features because they’re often used by defenders and security researchers as part of a process of building out a better understanding of a domain. In many cases, the data seen at scale tend to support those intuitions. Certain TLDs, for example, have reputations among security analysts as being dangerous “neighborhoods” of the Internet, and as this and previous DomainTools Reports show, there are indeed some TLDs that have high concentrations of malicious domains. Other criteria are more ambiguous; for example, we will see that when it comes to SSL certificate issuers, some readers may be surprised by what this large-scale analysis shows—and does not show—about where the danger lies. (We first saw these surprises in our Fall 2021 edition.)
Report Methodology
Candidate Domains
The DomainTools Iris database includes around 350 million currently-registered domains. How did we determine which of the candidate domains represent threats? There were two components to this. We identified domains that were known-bad by checking the domain names against several well-known industry blocklists which give indications of malware, phishing, or spam activity.
Secondly, we focused on those domains that were active (as of the report data snapshot), and therefore capable of packing a punch. Thus, we excluded domains that appear to be dormant. We did this by cross-checking the domains against our passive DNS sources; only those domains that have recently shown up in passive DNS are candidates for signal strength calculations.
Signal Strength
The tables in this report are populated and sorted based on the strongest signals for phishing, malware, or spam activity associated with the populations of known-bad domains sharing the characteristic (such as TLD, IP ASN, etc). The larger the proportion of malicious domains in a given population (an IP address, a nameserver, a registrar, etc) the higher our confidence that any unknown domain from that population may be involved in the threat in question. And in actual practice, many defenders treat these signals in exactly this way: many characteristics of a domain (such as certain TLDs or certificate authorities) are viewed as caution signs. Signal strengths closer to 1.00 indicate a neutral signal, and if the signal strength is below 1.00, the item in question is actually more associated with neutral/good domains than with malicious ones. There were some cases in which, for a given threat type, our Top 10 lists had fewer than ten entities with signals above 1.00 – in other words, there were some items in some of these lists that actually signal more goodness than badness—a phenomenon we first noted in the Fall 2021 edition of the Report. For this report, we took a snapshot of the domains in existence and active as of late March, 2023.
What Changed? What Didn’t?
In some categories, the findings this time around are remarkably similar to those in the previous report; the domain feature of SSL certificate issuer stands out in this respect, because for each of the three threat types, many of the top 10 issuers were the same as in the Q4 2021 report. In other categories, the lineup changes quite a bit.
We’re going to give you a small teaser of some of the interesting data from this edition of the report, but of course we invite you to take a deep dive and read the report itself. For the teaser, we’re looking at two of the Top Ten lists — one with results that probably won’t surprise most readers, and one that might!
A Tale of Two Top-Ten Lists: TLD and SSL Cert Issuer
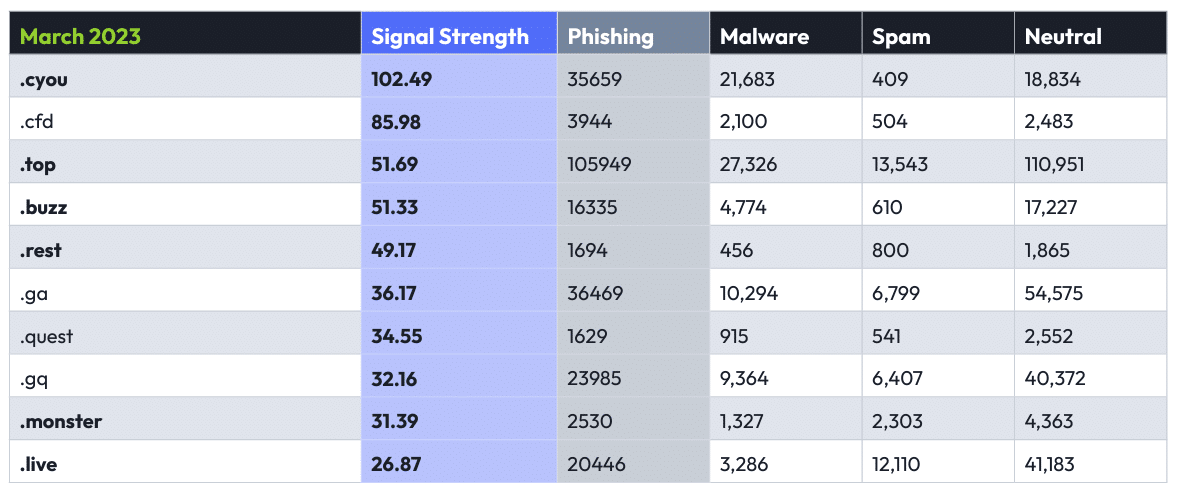
When defenders say that they automatically distrust certain TLDs, they have plenty of reason for doing so, as the following Top Ten list will show.
A development that preceded this report (but not by long enough to make much of a difference in the statistics) may have an impact on the next edition: Freenom, the domain registrar behind some of the TLDs in these lists including .ga, .gq, .tk, .ml, and .cf, shut down its registrations after being sued by Meta. Stay tuned for the next edition to find out what the impact might be on these numbers.
This table shows the top ten TLDs ranked by signal strength for phishing. The TLDs .buzz, .rest, .cyou, .top, .monster, and .live were all in the previous Top 10 list for phishing. More notable, perhaps, compared to the last edition, is that we observed a large uptick in the absolute numbers of phishing domains in .cyou, with over 35,000 domains this time versus just under 10,000 in the previous report. In fact, even though our new thresholding rule would have eliminated only one contender from the previous Top 10 (.rest, with a total of 426 phishing domains), the absolute numbers were substantially higher this time around across many of the TLDs.
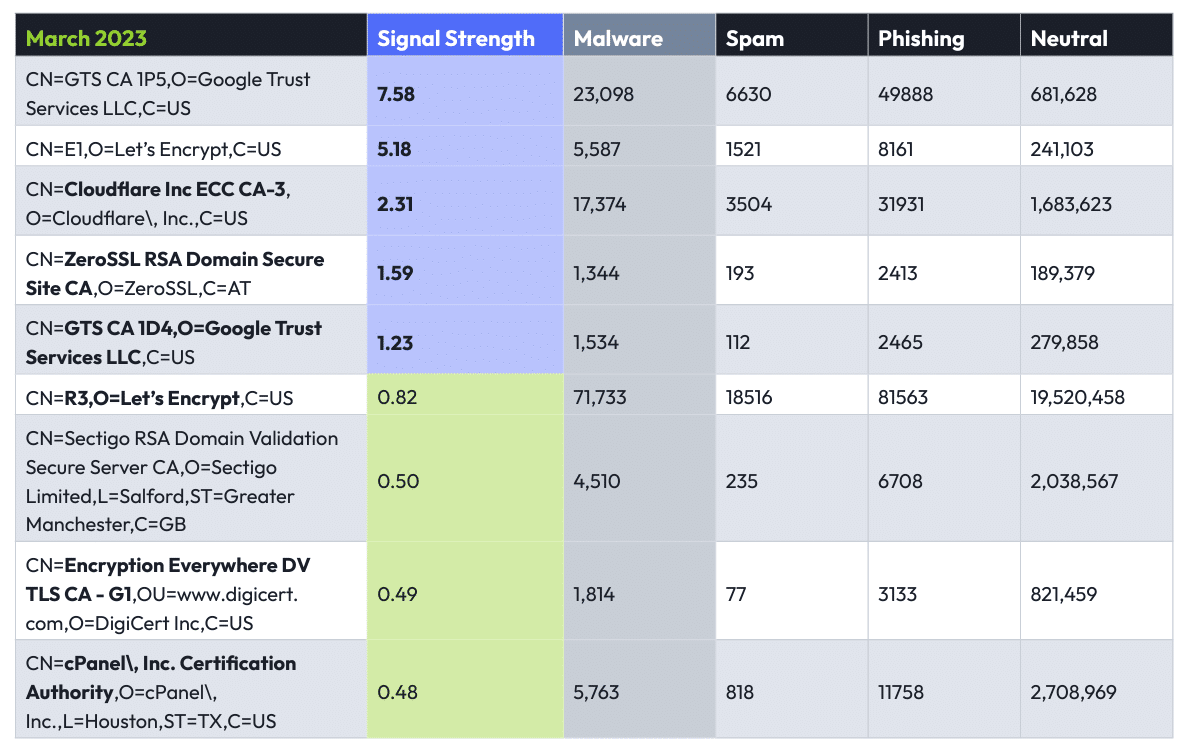
SSL Cert Issuers: Malware
This is where some of the more surprising data turned up: our “Top Ten” list of certificate issuers did not have ten entries—the issuers in green were actually more strongly correlated with neutral domains than with malicious ones. And among the issuers with a positive correlation (signal strength) with malware, the signal strengths themselves are very mild.
This may run at odds with some practitioners’ expectations—for example, we have heard many practitioners and researchers say that Let’s Encrypt certificates are a sign of sketchy domains. The data says otherwise—but the context is the key. A domain imitating a major brand, but with a Let’s Encrypt certificate (for example), is much more likely to be risky than a vanity site or a small-business eCommerce site with the same certificate issuer.
Conclusion
This is the second iteration of the DomainTools Report in what we plan going forward to be a rhythm of semiannual snapshots. Over time, we intend to glean trending information about the evolving nature of concentrations of malicious activity across the Internet. At the same time, as our change in thresholding methodology demonstrates, we may continue to make small adjustments in order to give what we judge to be the most useful insights.
We hope that this and future editions will be useful to others who, like the DomainTools team, are passionate about making the Internet a safer place for everyone! Drop us a line and let us know what you think.
Download the Full Report
Interested in more than a summary of the DomainTools Report? Look no further.
Read more from DomainTools