An Update to the DomainTools App for Splunk


As you know only all too well if the subject line of this blog got your attention, each second there is a massive influx of events in Splunk and similar tools. Can you relate? We’re pretty sure we know the answer to that! But stepping back a bit: in case you’re not already familiar with it, the DomainTools App for Splunk allows you to rapidly enrich domains with tagging, Domain Risk Score, domain age, Whois, IPs, active DNS, website and SSL certificate data to surface evidence of malicious activity. And now, with our latest release, we have made improvements we think you’re going to like if you already use the app, or which may pique your interest if you’ve not yet tried it out.
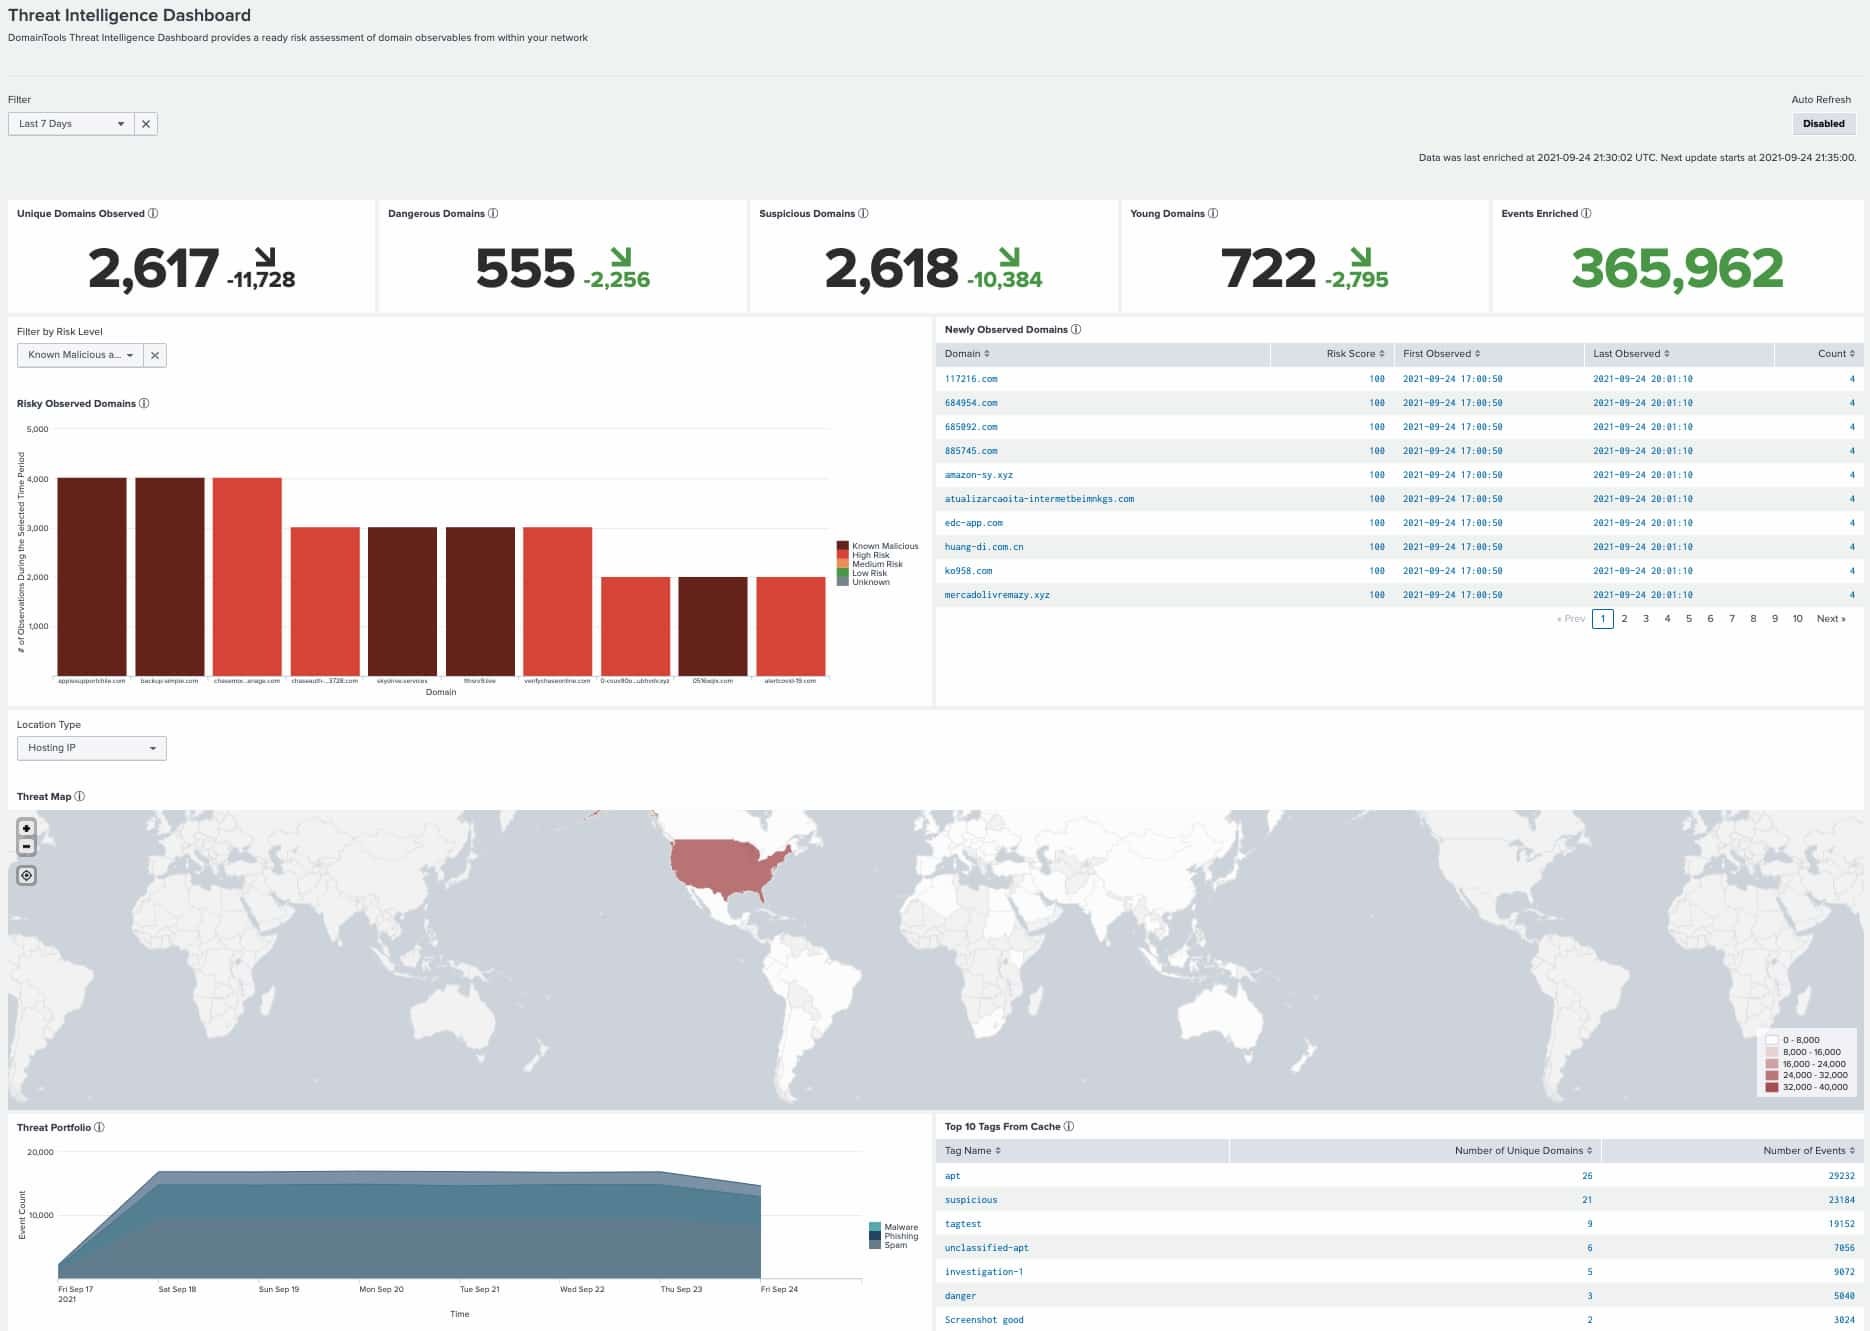
The DomainTools Splunk App 4.2 Dashboard
Splunk is very powerful, of course; that’s why in many organizations, there are one or more employees entirely dedicated to its care and feeding. Recognizing that you’ve got enough on your hands just getting the most out of your investment in Splunk, we’ve worked hard over the years to make the DomainTools app as easy to install, configure, maintain, and use as possible. Version 4.2 has several enhancements that can help with that. None of these changes is, by itself, revolutionary. But the little things add up, and can streamline your experience in the app, and save your team valuable time, with these enhancements. Here’s a thorough but far from comprehensive list of some of the things we’ve added and changed in the 4.2 release:
New:
- You can power an always-on SOC display with auto-refreshing Threat Profile and Monitoring dashboard panels.
- Time is of the essence, so this version can simplify your triage process, investigating domains flagged in Enterprise Security Incident Review within the DomainTools app Domain Profile page.
- Along the same lines, to expedite your workflow, you can now add domains to monitoring or allow-lists directly from DomainTools Enrichment Explorer.
- We’ve added a new regex-based dtdomainextract2 macro to improve performance.
- You can now natively enrich logs containing multivalue URLs (this might be especially valuable to you Proofpoint users).
Changed or Fixed:
- To improve performance, logging has been disabled by default. It can be re-enabled in the Diagnostic Panel.
- The app now allows for “Informational”-level urgency tags when creating Notable Events in Enterprise Security.
- We’ve expanded configuration levels for allow-list actions.
- The “Active Domains” panel on the Threat Intelligence Dashboard has been replaced by “Risky Observed Domains” to focus on the threat indicators of importance.
- Threat Portfolio and Domain Alerts Over Time timelines show the number of events instead of domains. (You can click on the legend entry to show all matching events of a given type during the filtered time period.).
- Threat profile panels preserve the search time frame in the Splunk query for a more consistent experience.
- You can now Search Enrichment Explorer and Domain Profile, or add to the Allowlist or Monitoring List using “defanged” domains (e.g. example[.]com—no need to delete those brackets now!).
- We removed the sparklines on dashboard panels—feedback from our users was that they were more confusing than helpful!
- And, last but most definitely not least – we’ve improved our in-app documentation and user guide.
If you’re curious about seeing it in action, be on the lookout for a webinar coming up on November 2 that will introduce the app in general, and also highlight some of these enhancements.
Finally, we’d like to thank our users for giving us valuable feedback on the app. Most of these changes originated directly from conversations with our customers. There’s no substitute for the expertise of the practitioners who use these tools every day to help make the Internet a safer place. Thank you!