Enrich More With Splunk 4.4


We are excited to share the latest updates to the DomainTools app for Splunk and Splunk Enterprise Security. With this new release, users can gain deeper insights into their network infrastructure and proactively identify potential security threats. For new users, the DomainTools integration with Splunk is already one of our most powerful, enabling organizations to enrich their log data with DomainTools predictive risk scoring, based on DNS, Whois, SSL, and related network infrastructure intelligence. Whether you’re an existing DomainTools Splunk user, or considering it in your environment, we’ve enhanced our robust platform integration with even more useful features, helping you identify, prioritize, and take proactive defense measures against risky Internet communication in your environment.
The latest updates for the DomainTools App for Splunk, versions 4.4 and 4.4.1, bring additional enrichment capabilities, completely reworked dashboards, a variety of enhancements to make the app easier to use, and a more streamlined installation process. While our dashboards continue to help highlight data of interest, we understand that many users prefer to interact with data on their own dashboards and custom Splunk searches. For a general overview of the app, please check out our related webinar. In this article, we’ll walk you through a few of these new, exciting features.
Inline Farsight DNSDB Enrichment
DomainTools acquired Farsight Security in late 2021 and has been integrating its industry-leading Passive DNS visibility into more of our products. Version 4.4 of the DomainTools App for Splunk extends the integration further with a new inline DNSDB enrichment command, dtdnsdbenrich, available to provide near-real-time visibility of DNS queries and responses, enriching via SPL (Splunk’s Search Processing Language). This can help you identify potentially-risky infrastructure associated with a domain or IP. For example:
- Was this domain’s infrastructure recently established? (check the first seen date)
- Is it targeting just you? (look for patterns of subdomains, in addition to Iris Investigate pivots)
- How sophisticated is this infrastructure? (does it have associated mail servers, multiple IPs, SSL certificates, etc.)
While most of these factors weigh into DomainTools risk scoring calculations, peering a level deeper can help you identify threats pertaining to your investigations. Here are a few examples of how you might put that to use:
Enrich 30 events from the main index with Iris Enrich and DNSDB Passive DNS:
index=main
```resolve urls to domains, limiting to 30 for this example```
| dtdomainextract field_in=url field_out=domain
| dedup domain
| head 30
```look up with Iris Enrich```
| dtirisenrich domain=domain inline_results=true
```look up with DNSDB```
| dtdnsdbenrich field_in=domain field_type=domain max_count=5
| eval dnsdb_first_seen=strftime(dnsdb_time_first, "%Y-%m-%d %H:%M:%S")
| table url domain, en_risk_score, en_additional_ips_raw, en_registrar, en_domain_create_date, dnsdb_first_seen, dnsdb_rdata
```sorting by first seen lets us prioritize new infrastructure```
| sort -dnsdb_first_seen
There are a few things to point out in this command: dtirisenrich is an eventing command that queries the DomainTools Iris Enrich API for up to 100 comma-separated domains at a time. We’ve added a new parameter to it, inline_results, allowing you to preserve pass-through fields from an upstream command. It’s not enabled by default though to preserve backwards-compatibility. dtirisenrich returns domain risk score, IP, SSL, whois, and active DNS information.
dtdnsdbenrich is a new command that enriches a list of domains or IPs with the Passive DNS information returned from Farsight DNSDB. We supply it with the name of the field containing the item to be enriched, domain, and the input type of data contained in that field, “domain” data (IP/subnet or raw hex are alternate input types). To keep the results readable, we’ve capped the max_count to 5 and are only displaying a subset of the fields returned, formatted the unix date into human-readable time, and sorting by first seen to prioritize newly-established infrastructure:
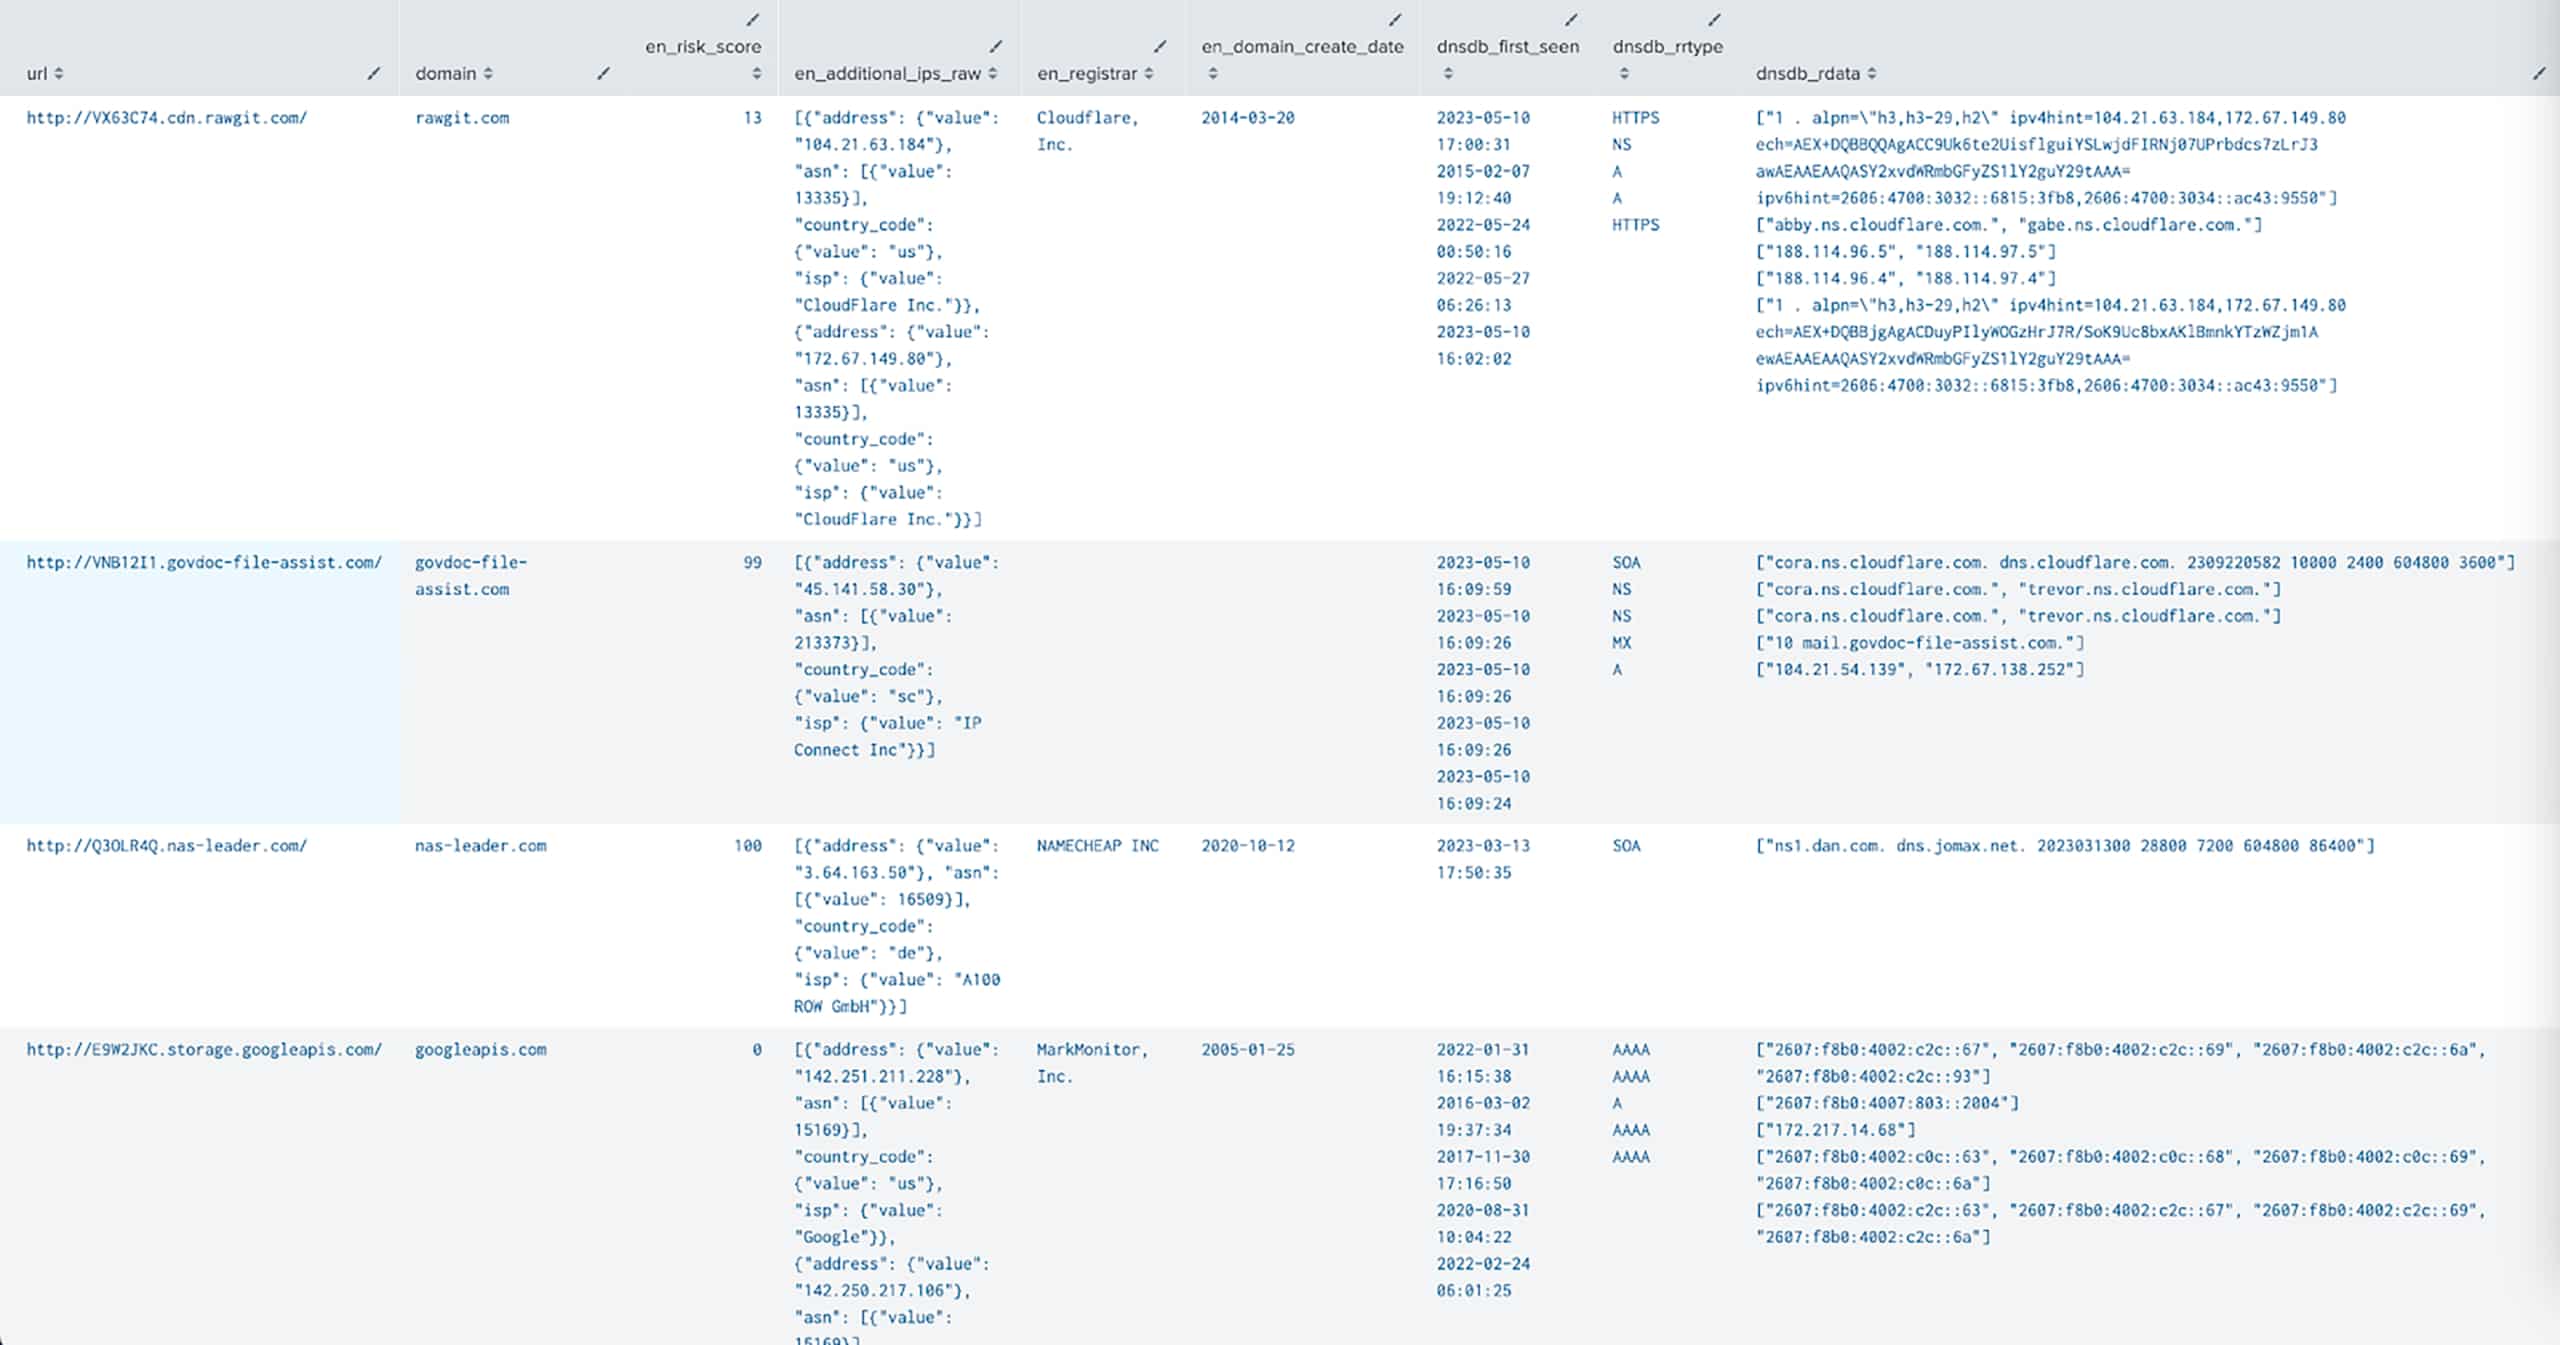
A screenshot from our demo environment is displayed above with simulated traffic but actual infrastructure data. At a glance, you can already see a lot of useful information:
- A risky domain with a SOA record, name server, and mail server record first seen on the day of this writing
- A domain with a Risk Score of 100, indicating it had been present on a risk feed, but is now parked
- Two domains that can be ignored due to low risk and old creation/first seen dates.
A word of caution though: changing your usage pattern to go from ad-hoc domain investigation to full inline enrichment against sets of indicators can quickly consume DNSDB daily usage quotas. You can keep an eye on your quota under the API Keys page within the Splunk app by clicking on “View Account Information.” Our Enterprise Support team can help you right-size to take advantage of these features. (And if you haven’t already added DNSDB to your account, reach out to your account representative or Enterprise Support. Some of our packages include DNSDB API access).
Enriching with Subdomain Activity
The dtdnsdbenrich command can also help you contextualize domain indicators by showing active subdomains seen in passive DNS traffic, filtering for rrtype=A and setting include_subdomains=true. For the sake of example, let’s start with new domains discovered by Iris Detect (our domain discovery product aimed at uncovering lookalike domains that may be targeting your brand or supply chain). There’s a section in our user guide to help you get set up ingesting those domains into Splunk for alerting and triage. You can augment and prioritize these, or any list of domains, by adding subdomain activity observed in Passive DNS traffic:
| from inputlookup:dt_iris_detect_results
```Look up in DNSDB, time fencing to 1 day before this writing```
| dtdnsdbenrich field_in=dt_domain field_type=domain lookup_type=rrset rrtype=A include_subdomains=true time_first_after=1686182400
```Format timestamps, and keep only the first DNS resolution```
| eval dnsdb_time_last_formatted=strftime(dnsdb_time_last, "%Y-%m-%d %H:%M:%S"), dnsdb_time_overall_first=min(dnsdb_time_first)
```filter for only domains with DNSDB results```
| search dnsdb_rrname != ""
```timedelta tracks the time between the Domain's existence and the first Passive DNS query```
| eval timedelta=dnsdb_time_first-dt_discovered_date
| table dt_domain dt_risk_score timedelta  dnsdb_rrname dnsdb_time_last_formatted dnsdb_count
| sort timedelta

Our Iris Detect search terms are looking at “Slack” and “Microsoft” and initially had 343 new domains within the past 24 hours (note that we added the time fencing command time_first_after on that DNSDB search). We’ve narrowed down that set to just 10 that merit a look based on the presence of active subdomains. Additionally, we’ve labeled “timedelta” as the number of seconds difference between when a domain was first seen by DomainTools and when Farsight DNSDB first saw traffic to the domain, to indicate a newly active domain. Anything with infrastructure set up rapidly is generally a risky sign. Sorting by “timedelta” allows us to prioritize which domains to look at, likely the top 4 to 7 domains in this example.
A Note on the New Iris Fields
An April 2023 update added some additional fields to the Iris Data Set: “website title”, “server type”, and “lifecycle first seen”. “Lifecycle first seen”, or “First Seen” as shortened in the API response, is the date and time when DomainTools identified a domain as newly active. It is generally more useful than the “Create Date” which is not always provided in a Whois record. This data is returned via the API response and stored in the _raw field of the dtirisenrich response as well as the dt_iris_enrich_data KV store (cache). We can add the website title, server type, and first seen date to the Iris Detect results above as follows:
| from inputlookup:dt_iris_detect_results
```Look up domains in Iris Enrich```
| dtirisenrich domain=dt_domain
```Parse the new fields from the raw API response```
| eval enrich_first_seen = json_extract(_raw, "first_seen.value"), enrich_website_title = json_extract(_raw, "website_title.value"), enrich_server_type = json_extract(_raw, "server_type.value")
| table en_domain_name enrich_first_seen enrich_website_title enrich_server_type
DNSDB Enrichment of IPs
The dtdnsdbenrich command can also help you prioritize indicators based on IPs. Let’s continue to use the Iris Detect results as a source of IPs this time. We’ll enrich those IPs with associated domain names based on passive DNS traffic, then add the associated DomainTools Risk Score:
| from inputlookup:dt_iris_detect_results
```Source some recent IPs associated with domains from Iris Detect results```
| spath output="ips" input=dt_ip_raw path={}.ip
| table ips
| search ips=*
| mvexpand ips
| head 25
```Enrich IPs with up to 500 colocated hostnames```
| dtdnsdbenrich field_in=ips field_type=ip max_count=500
| mvexpand dnsdb_rrname
```resolve FQDNs to registrable domains```
| dtdomainextract field_in=dnsdb_rrname field_out=domain
| dedup ips domain
```Enrich domains with Iris Enrich```
| dtirisenrich domain=domain inline_results=true
| table ips dnsdb_rrname domain en_risk_score
| sort -en_risk_score
```Group by IP, computing the average risk score of the overall set, and the top 5 riskiest associated domains```
| stats list(*) as * BY ips
| eval average_risk_score=round(avg(en_risk_score),1)
| eval riskiest_domains = mvindex(domain, 0, 4)
| eval riskiest_domain_scores = mvindex(en_risk_score, 0, 4)
| table ips average_risk_score riskiest_domains riskiest_domain_scores
| sort -average_risk_score
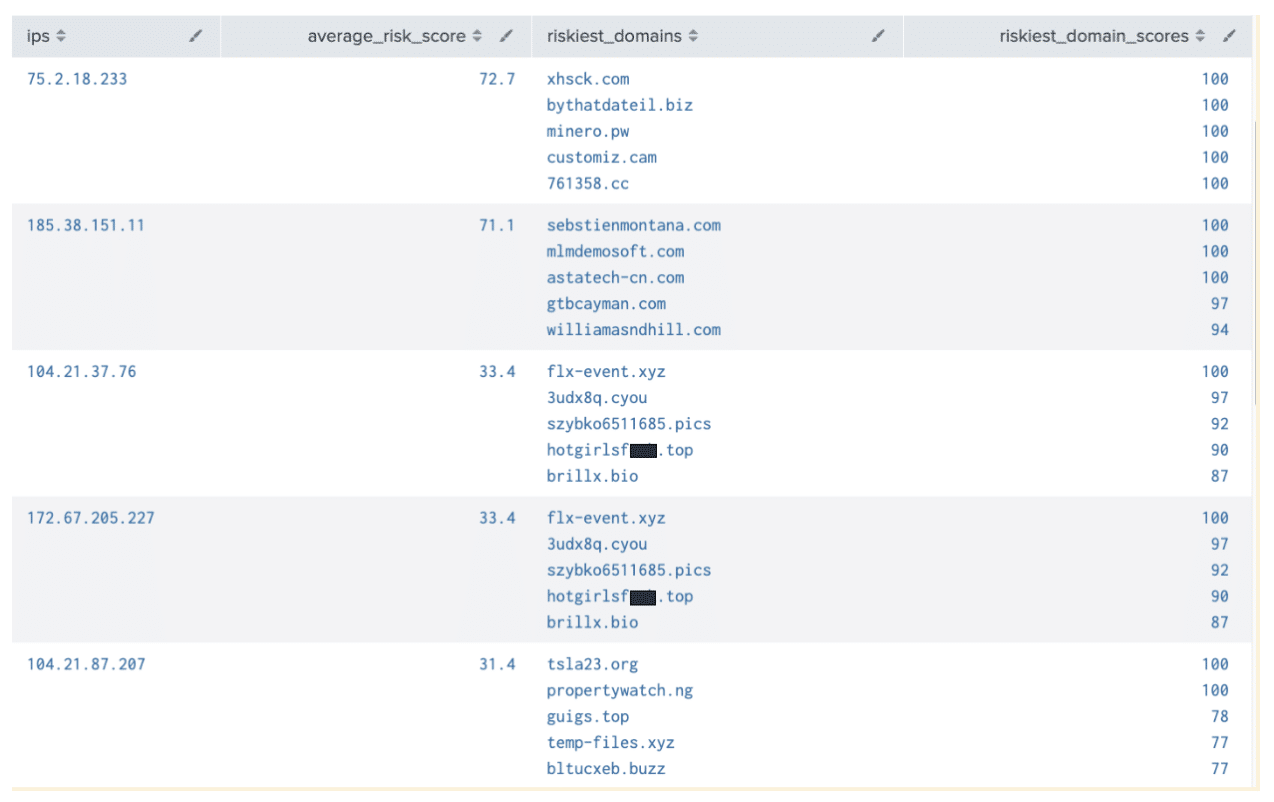
We used Iris Detect-related IPs in this example, but the concept would apply to any list of IP indicators. Adding this context can help you narrow down your indicators to a more manageable set based on the presence of observed DNS traffic that maps to high risk domains. There’s an important caveat to note here: we’re limiting the results to 500 domains associated with an IP, averaging the risk of those, and displaying the top 5 riskiest. We could get more precise data at the expense of query execution time by using a higher max_count or adding in time fencing (dnsdb_first_seen) to refine the domains of interest that are associated with the IP.
Improved In-App Documentation
You can take advantage of all of the new inline enrichment features with improved in-app documentation that complements the full descriptions listed in the user guide (accessible under the “help” menu). Make sure “Preferences” -> “SPL Editor” has the search assistant set to “Full” to see the full description as in the example below:
The new and expanded help text is available on most of our custom search commands: dtirisenrich, dtirisinvestigate, dtaccountinfo, dtimportirisdetectmonitors, dtimportirisdetectresults, dtdomainextract, dtdnsdblimit, dtdnsdb, dtdnsdbflex, and dtndsdbenrich.
Enhanced Enterprise Security Tie-In
Users of Splunk Enterprise Security can now quickly pull in additional context from DNSDB or Iris into the Incident Review panel. Anytime a notable event includes a domain or URL field, we’ve expanded the right-click enrichment options:
Rebuilt Dashboards
Last but certainly not least, those of you who prefer to use the dashboards built into our app (and we highly encourage you to try them out!) will be relieved to know the persistent nagging HTML dashboard warnings are gone!
Every page of our app has been rebuilt using Simple XML or React. That means no more unrestricting older versions of jQuery and unsupported hotlink imports, at least not on our behalf. Splunk GovCloud users should be back up and running with full functionality.
The rewrite means some pages have a new look to them. Here’s the redesigned Monitoring Dashboard, for instance:
Some pages might look a bit different with the newer design standards, but almost all functionality has been preserved. The Iris Detect page has been separated into two pages: a “Monitored Terms” page to set up which search terms you’d like to ingest into Splunk, as well as an Iris Detect Dashboard to triage the results of that monitoring as in the example here:
As an added bonus, the new pages also play nicely with dark themes! (Force it with a theme=dark URL parameter or use a browser extension until Splunk enables it fully)
Find Us on Splunkbase
This post is only highlighting what’s new in 4.4 and 4.4.1. There’s so much more our app provides. For a full change log, and to download the new app, find it on Splunkbase: https://splunkbase.splunk.com/app/5226
We invite you to give the app a try. Our detailed guide, accessible via the “Help” menu in the app, has all the steps to get you started or upgraded. If you need a license key, our team would be happy to assist. For existing customers, you’ll need access to at least Iris Investigate, Iris Enrich. Optionally add Iris Detect and DNSDB for full functionality. Please reach out to enterprisesupport@domaintools.com to ensure your account is fully provisioned to be able to take advantage of all the features available in the DomainTools for Splunk app.
Read more from DomainTools