
I often dream that our investigation workflow would look something like this: you press the ‘Start Investigating’ button, sit back with a cup of coffee—or tea if you feel so inclined—and the app does the rest of the work of collecting, segmenting, and alerting for you. And all you would have to do is press the ‘Stop Investigating’ button and review the prioritized list of flagged IOCs—all in under 5 minutes.

DomainTools is always looking for ways to make life easier for you, whether you’re immersed in one of our investigation platforms or just consuming our dataset in another tool—including in a powerful platform like Splunk.
If you’re familiar with the DomainTools Splunk App, you already understand the benefit of bulk enriching your network observables with the DomainTools intelligence dataset in real-time. And, if you are reading this, you are probably wondering how this could possibly be made better.
Aside from the fact that I have still not solved for that ‘Start Investigating’ button yet or for the other things we (the tech civilization) haven’t collectively nailed—like predicting pandemics, containing wildfires, and getting cars to fly—the future looks optimistic.
While my dream persists, we have been busy making small, incremental progress. And I think we should talk about some of the nifty little things (aka features) we recently added in this latest app release.
Investigations in Splunk
If you’re a DomainTools power user, you may know some crafty ways to leverage Splunk’s Search Processing Language and invoke DomainTools’ generating commands to perform lookups. But that may not be convenient for everyone.
With this version, we are introducing investigation capabilities inside of Splunk. While profiling a domain IOC out-of-band, you can now discover potentially malicious domains that share connected infrastructure. We display these connected infrastructure components as viable investigation paths within the Splunk UI so you can conveniently pivot (aka click-a-button) and pull in all the domain IOCs that DomainTools has already discovered.

This is extremely powerful, as you can now maintain investigation context by directly launching the Iris investigation platform or by proactively monitoring these malicious domains inside Splunk using DomainTools Monitoring capabilities.

Improved Context
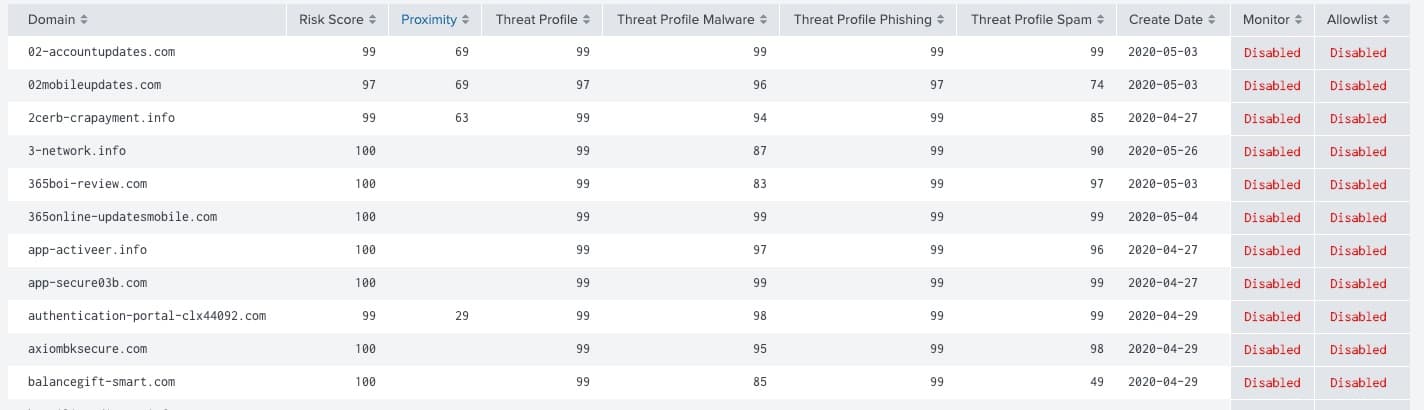
Consider a scenario where you’re scanning through newly-discovered domains associated with a domain observable, and you now need the ability to assign a weight to the badness of these IOCs you know nothing about. Fear not! You will now be able to see the DomainTools Risk Score for all these domains along with their Threat Profile within Splunk and within the context of your current investigation.
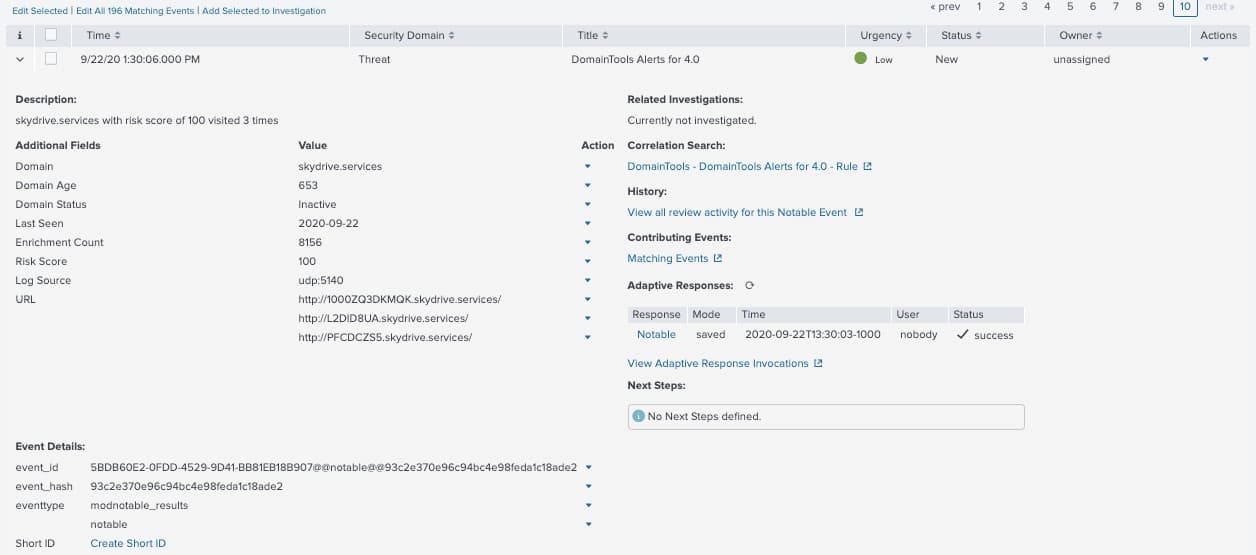
And if you are a Splunk Enterprise Security user, the DomainTools notable event will now surface some of the key enrichment data that you would need for faster triaging.
App Interface Reimagined
The latest version presents all these data enrichment and investigation capabilities in an improved user interface. User interface elements such as menus and data-tables were redesigned based on how you actually consume data, where you need it, and where it may add the most context for you.
Configuration and management of third-party apps are cumbersome. Yes, we agree. And although we may never be able to bring the same level of flexibility as we would have if it had been a native app, we made it easier for you.
You can now configure, reconfigure, validate, and debug key components of the app all from the UI using click-through menus.
Another example of how you can easily gain context from our vast intelligence dataset during investigations: The domain profile page view now visually separates data components across risk scores, evidence, and the popular-yet-ever-shrinking Whois information. This profile view also surfaces any recent events from your network containing the investigated domain.
General Availability of DomainTools PhishEye Functionality
Not so long ago we introduced PhishEye capabilities inside of Splunk. At the time, we received validation of these capabilities from our user base along with constructive feedback on areas for improvement. We used that feedback to make it better.
You now have a completely redesigned and improved end-to-end workflow for retrieving monitors (brands or terms) from PhishEye and pulling in newly discovered domains for downstream monitoring or management inside of Splunk. With your workflow in mind, the app allows you to conveniently manage the entire process with easy click-throughs and navigation.
Support for Splunk 8.0
If you are using a Splunk 8.x release, you now have a certified app to deploy in your environment. The latest version will support python3 and python2 (if you insist) within your environments.
This app version was rebuilt from scratch to leverage new capabilities the Splunk SDK introduced recently. You can expect faster searches in your dashboards and the ability to correlate more events across our dataset.
While there are many additional features like Diagnostic, Usage Dashboard, or Domain Allowlist that we can discuss here, I invite you to explore these while trying out this new app.
In conclusion, while our current reality remains a bit distant from my ultimate dream, we continue to chip away at it, and I hope someday we can have that ‘Start Investigation’ button to press, or, better yet, have a form of augmented reality press the button for us while we luxuriously sip our coffee (or tea).
Please continue to take care of yourselves, be safe, and happy hunting!
To learn more, join Splunk and DomainTools to learn how the DomainTools App for Splunk offers enhanced capabilities, performance, and user experience.