New Report Available: Aggregate Count Data for All Internet IPv4 Addresses as Seen in DNSDB “A” Records
Share this entry
Curiosity about the Internet is “in our DNA.” DomainTools mission is “To map the Internet to detect and predict emerging threats.”
Farsight Security, now part of DomainTools, previously reported on both domain names and IP addresses seen in Farsight DNSDB. However, the most recent IPv4 address study (from way back in 2017) only looked at coverage/visibility, not usage/volume.
A lot has also happened since that time, including expansion of our sensor footprint and effective exhaustion of available IPv4 address pools at ARIN, RIPE NCC, APNIC, and the other regional registries. Given those changes, what do we see for utilization of the IPv4 address space that has been allocated/assigned to the world’s Internet users?
Here, we update and extend the earlier study to focus on the aggregated cache miss counts seen for each /24 netblock for the entire Internet IPv4 address space (see graph above). That image represents totals for over 16.7 million dnsdbq /24 summary queries, timefenced to a 90 day period. Areas with the highest observation counts are “hot yellow,” while areas with lower observation counts are “cool purple.”
Some /24 netblocks have unusually large aggregate counts – including aggregate cache miss counts in excess of 175 billion. We dig in on some of those “heavy hitters,” reporting on the domains that appear to be most heavily contributing to those huge cache miss counts.
At the other end of the cache miss “aggregate count spectrum,” we find that over 75% of all /24 netblocks have aggregate cache miss counts of 100 or less.
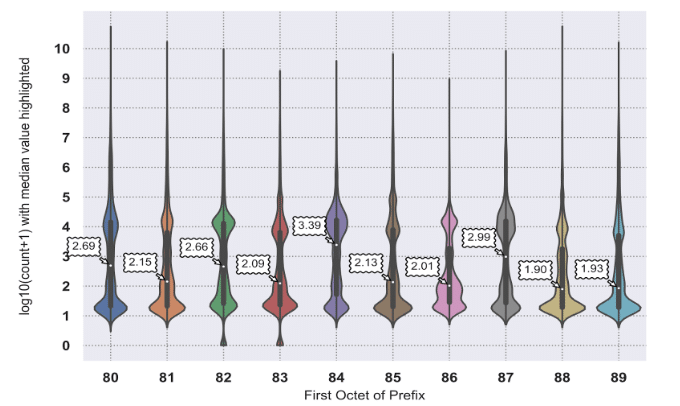
Violin plots and individual Hilbert curves are provided for each IPv4 /8 for those who may wish to dig in more deeply.

(A score of 2 on the vertical axis represents 10^2 or 100 while a 9 on the vertical axis represents a count of 10^9th or 1,000,000,000)

This report also introduces and demonstrates the value of improvements to query meta-data reporting in the company’s command line DNSDB client, dnsdbq, when dnsdbq is used for bulk queries of this sort.
For the avoidance of doubt, this report does NOT purport to describe the “most popular” IPv4 address space — cache miss counts are heavily influenced by things like TTL values and caching; conversely, it also doesn’t describe “unused” or “fallow” IPv4 address space — just because we didn’t see traffic for a CIDR doesn’t mean those IPs aren’t in use. Nor does this report disclose where we collect passive DNS, or queries that customers may have made against DNSDB. It simply shows where DNSDB has seen “A” records resolve to, and the volume of those cache miss queries.


