New Report: DNS Network Traffic Volumes During the Pandemic: April 2020-March 2021
In 2020 Farsight issued a preliminary 95-page report entitled, “DNS Network Traffic Volumes During the 2020 Pandemic,” reporting on a two-month sample of passive DNS data for 316 selected domains taken from March and April 2020. At that time we were only just beginning to learn how Covid-19 would change the world.
Now that the medical community has learned much about the virus and vaccination is rapidly happening (and hopefully the end of the pandemic is in sight), we wanted to release an updated report. Our new 439-page report describes the volume that Farsight saw for 341 selected 2nd-level domains drawn from 11 broad areas, day-by-day, as collected over the period from April 2020-March 2021. Areas we studied included 1) a set of baseline sites, 2) Covid-19 governmental sites, 3) news and opinion sites, 4) retail sites, 5) social media sites, 6) sports sites, 7) streaming video sites, 8) travel/tourism/transportation sites, 9) universities, 10) video conferencing sites, and 11) video gaming sites. The sites included in this report partially overlap with the original report, but also include a more targeted set of sites now that we know more about how the pandemic hit the world.
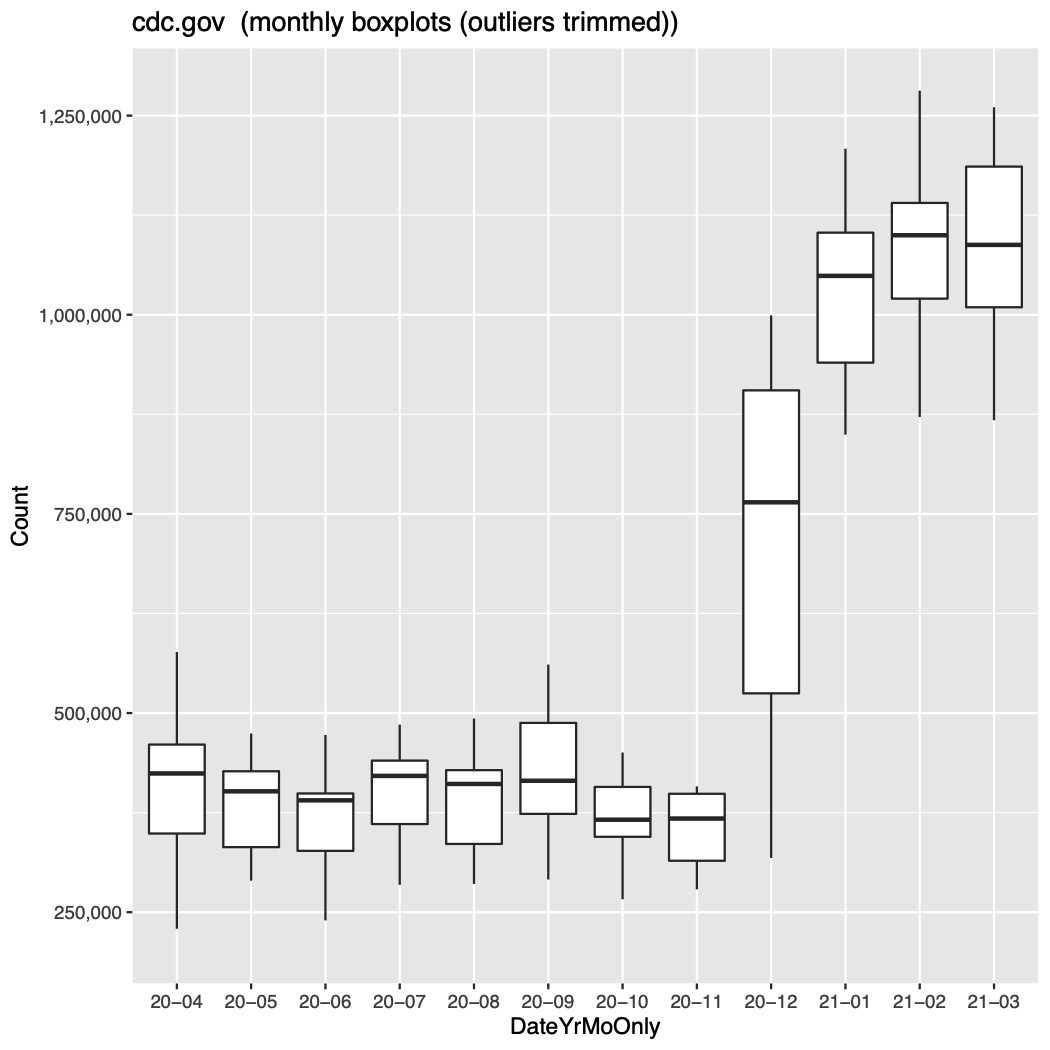
The bulk of the report consists of summary graphs built in with the “R” statistical package. We show two graphs for each selected domain, one a dotplot showing raw daily counts (and a smoothed 28-day moving average), and the other a boxplot showing data aggregated by month (with extreme outliers trimmed).


Changes over time are readily discernible in both graphs for most sites.
We’ve impressionistically tagged each graph according to its shape, overall volume, and whether or not Denial of Service (DoS) traffic may be present.
We hope you find the new report to be of some interest. You can download a copy here.


