Stand and Report: Iris Investigate Collaboration Features Roll On
In July, we introduced a suite of collaboration features in Iris Investigate that allow investigators to share their work and add commentary to their investigations, to give other Iris Investigate users more context on what they are researching. Today, we introduce the third feature in that triple crown: Iris Investigation Reports.
There will be times when you may wish to share your findings with others inside or outside of your organization—folks who may not be Iris Investigate users. To do this, you can now create a printable report, exported as an a .pdf document, with the following information from your investigation:
- Title and Summary: These are taken from the name and description (if any) that you have given to the investigation. We also include a hash representing the current search, which you can send to another Iris Investigate user to import into their view of Iris Investigate.
- Investigation Path: A tabular representation of Search History, indicating what actions led to each set of results. If Notes were added to any node of Search History, the notes are included in the Report.
- Stats: The contents of the Stats data panel are listed by section.
- Visualization: The Visualization graph is depicted.
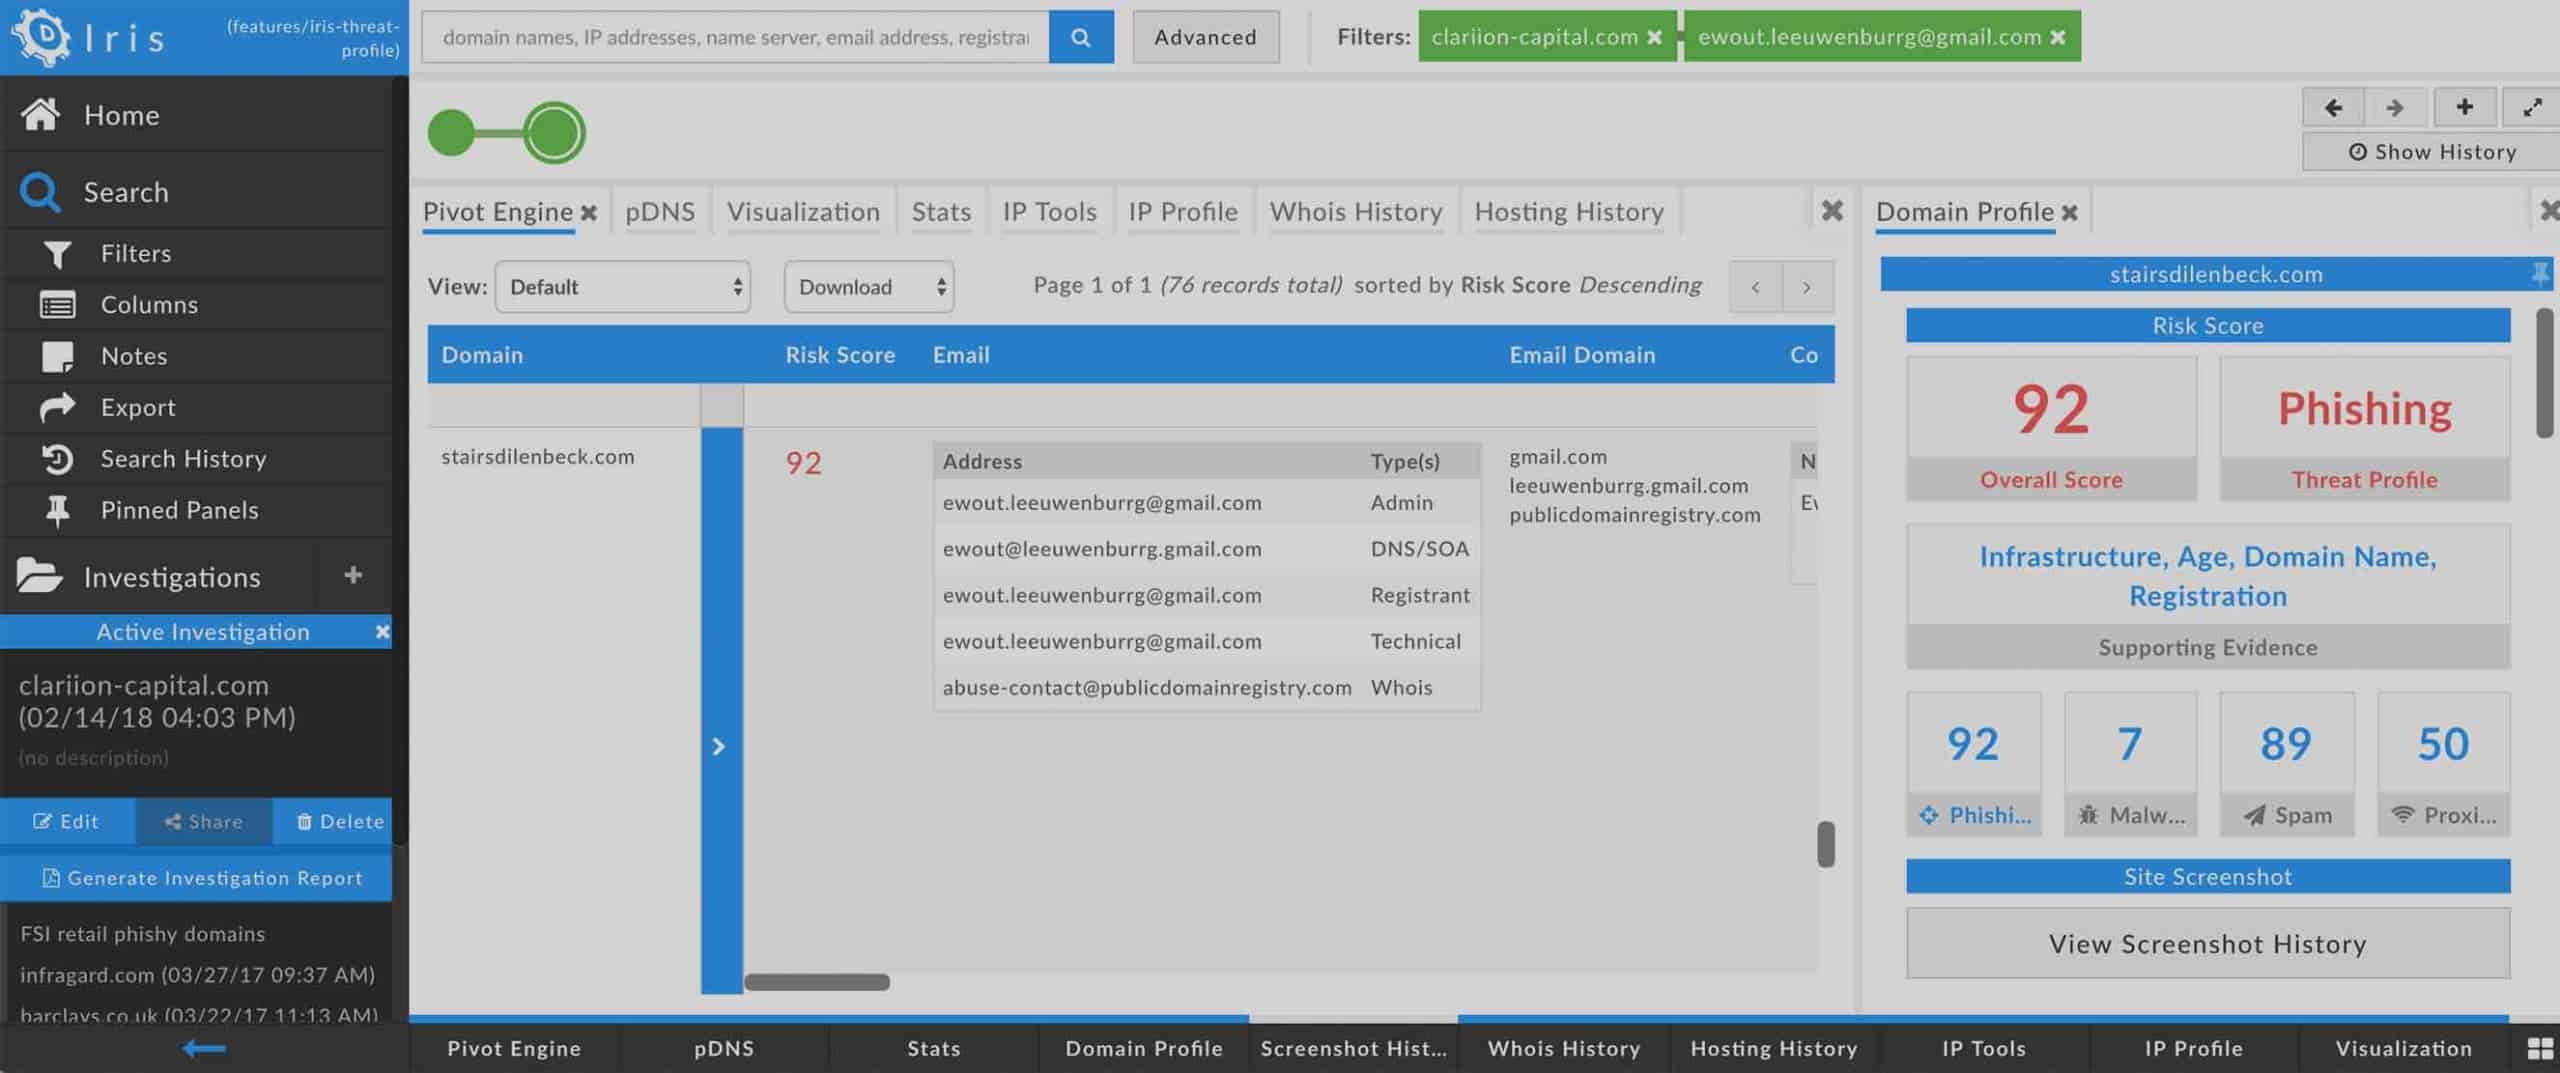
- Pivot Engine: The data from the Pivot Engine is given in tabular format. The columns in this section of the Report correspond to the columns you see in your Pivot Engine view.
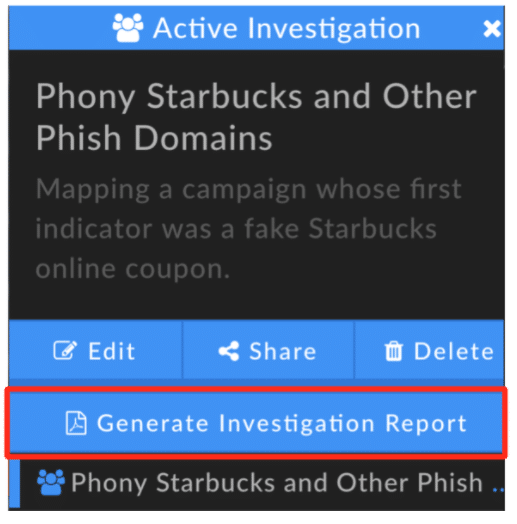
You don’t have to do anything to get the Reports capability—it is already live! Look for the button, circled in red here, in the navigation bar on the left side of the Iris screen:

There are several things to know about how Reports are generated:
- The report is based on the current search. If you have revisited an earlier step of your investigation but want to report on the final step, be sure to click on that step in Search History before you generate the report.
- The Stats, Visualization, and Pivot Engine Data Panels have to be active in order for their contents to be included in the report. Stats and Pivot Engine don’t have to be in focus, but they must not be completely closed.
- The Visualization panel must be in focus (i.e. presented on your screen) in order to be included in the report. The report will show Visualization as it appears. This means you should center the graph and adjust the zoom level according to how you wish to see it on the printed page. (By the way—if you have a large graph that you want to show in high-res, you can download an SVG image of it right from the Visualization panel).
- For searches with results over 500 domains, the report will reflect the page of results on Pivot Engine that you are currently viewing. For example, if you have moved Pivot Engine to Page 2, the report will print the domains and Visualization of the domains shown on that page.
We hope you’ll find Reports as gratifying to use as it was for us to build! As always, we’re happy to receive your feedback.
Happy exploring!


