Visualizing the incidence of IPv4 addresses in Farsight's DNSDB

Introduction
Recently, a customer asked “..how large is the DNSDB population of IP addresses with “current” DNS records?” I had somerough back of the napkin estimates, but nothing concrete. The article thatfollows is my take on finding a more calculated answer to that question.
To approach this problem we first need to define some elements of the question.First, we will define “current” by stating observations captured in theselected set of DNSDB-export mtblfile(s) are current for that set. We can run this analysis on anHour/Day/Month/Year of data. For this study, I choose to run three passes, onewith a daily file (2017-FEB-03), one with a monthly file (2017-JAN) and finallywith a yearly file (2015). (At the time of this writing the 2016 yearly filewas in the process of being generated so I chose our 2015 rollup). We willdefine DNS activity as the appearance of an A record with a valid IP addresswithin the subject file (of course as we are looking at A records, we are onlylooking at IPv4 address space).
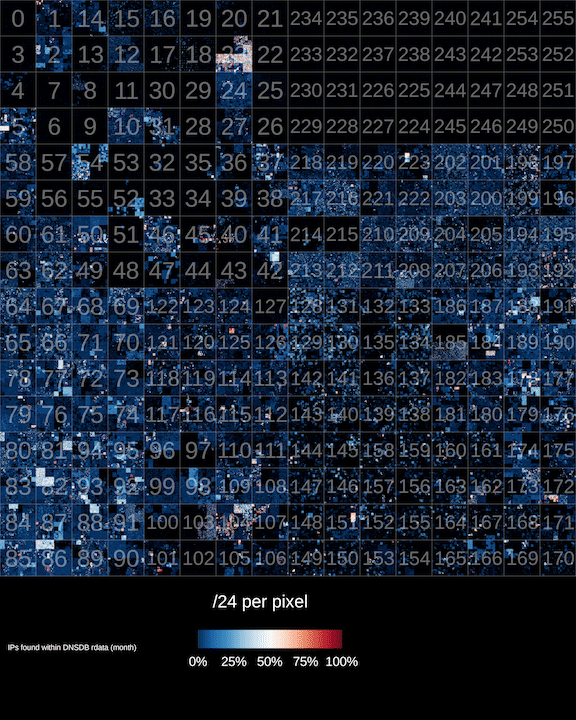
The finished product is shown below (read on to learn what it all means andhow it was built):

(A higher-resolution version of this image is available here)
The Tools
To facilitate the process of collecting the data I created a quick set ofIPv4 mapping tools in golang to manipulate a one-bit per address bit-map. This tool setconsists of the following three tools:
- setup – creates an empty bit-map file,
- addd – the “add daemon” is a daemon that listens for connections on alocal TCP port and sets the bit for any newline separated IP addressessubmitted to the socket. Finally the
- read – tool takes a filename of a bit-map file and outputs an orderedstream of new-line-separated dotted-quad IPv4 addresses.
These tools provide a simple pipeline model for handling a large list ofIPv4 addresses with Unix tools like sed, awk, grep, nmsgtool etc.
The Process
Let’s work through a simple example. First initialize an empty data-file:
$ ./setup data.dat
Now start the daemon by specifying the data file and TCP port number to listenon:
$ ./addd data.dat 4444
Next we will populate the data file by transmitting a newline separated list ofdotted-quad IPv4 addresses to the TCP socket.We generate the data using the dnstable_dump command to output an ordered stream of rdata records from the subjectmtbl file then filtering the output to contain only “A” records with properlyformatted IPv4 addresses:
$ dnstable_dump –d dns.20170203.D.mtbl | grep –e “ IN A “| awk{‘print $4’} | uniq | nc localhost 4444
The IP addresses are passed over the network socket by way of the netcat utility. In this case,
localhost:4444
is ourinstance of the addd tool. The bits mapped to the IP address of the A recordsin the data is then set to one. At this point, we can perform some quickanalytics and get a feel for the kinds of numbers that we are looking at. Forthis I use the read tool to generate a list of IP addresses where the bits areset to one in the bitmap file and pipe the output to typical command-linetools. Read can also be called with the argument zero which will emit a listof IPv4 addresses where the bit is set to zero.
Let’s start with a simple line/IP count:
$ ./read data.dat one | wc –l
...
Sticking this output from this command into a table we see the following:
|File |Total |# In Use |% In Use |# Unused |% Unused ||—–||
2017-FEB-03
|
4,294,967,296
|
12,904,017
|
%0.30
|
4,282,063,279
|
%99.69
||
2017-JAN
|
4,294,967,296
|
37,266,823
|
%0.86
|
4,257,700,473
|
%99.13
||
2015
|
4,294,967,296
|
69,044,394
|
%1.60
|
4,225,922,902
|
%98.39
|
We observe approximately 1% of the total IPv4 address space in DNS on a monthly basis and about 1/3 of a percent on a daily basis. The size of the daily in-usecount tracks to about 12 Million addresses per day over the week of data that Ichecked.
Next, we can compare the daily files:
$ ./read 20170203.dat one > ips.20170203.txt
$ ./read 20170204.dat one > ips.20170204.txt
$ sort ips.20170203.txt ips.20170204.txt | uniq -d | wc –l 10720088
Comparing the day files for 2017-FEB-03 and 2017-FEB-04 we see anoverlap of 10,720,088 IPs that were seen in both day files. This leaves us withabout 2.2 million addresses worth of churn in one day.
A note about the size of IPv4 address space
Beware that the 4,294,967,296number of addresses is based on the entire 32-bit size of the IPv4 addressspace. Not all of this space is routed or even open for allocation. Carve-outssuch as RFC-1918, multicast space and“Class E” AKA “Future use”address space reduce the overall usable space of IPv4, however the DNS A recordignores these limitations and is represented as a 32-bit number. There areapplications that make use of A records as a 32-bit number so some addressesfound in this study are not functional IP addresses. For this exercise, we arewilling to live with this.
Generating the IPv4 Hilbert Curve Heatmap
After loading the data into the data.dat file, we can use the read utility toextract it and feed it into ipv4-heatmap. Ipv4-heatmap takes as input a stream of newline separated dotted-quadIPv4 addresses and plots them onto a Hilbert curve heatmap (the sameHilbert curve made popular for IP mapping by xkcd.For this example we’ll use the default mode which generates an image where each pixel inthe body of the graph represents a single /24 netblock. The color of the pixelindicates how many of the individual addresses within that /24 were found inthe data-source.
The command is as follows:
$ ./read data.dat one | ipv4-heatmap \
  -u "/24 per pixel" \
  -h -d -i -P rdbu\
  -f ~/ipv4-heatmap/extra/LiberationSans-Regular.ttf \
  -t "IPs found within DNSDB rdata (month)" \
  -a ../slash_eight.annotations \
  -o ./images/map_day.png
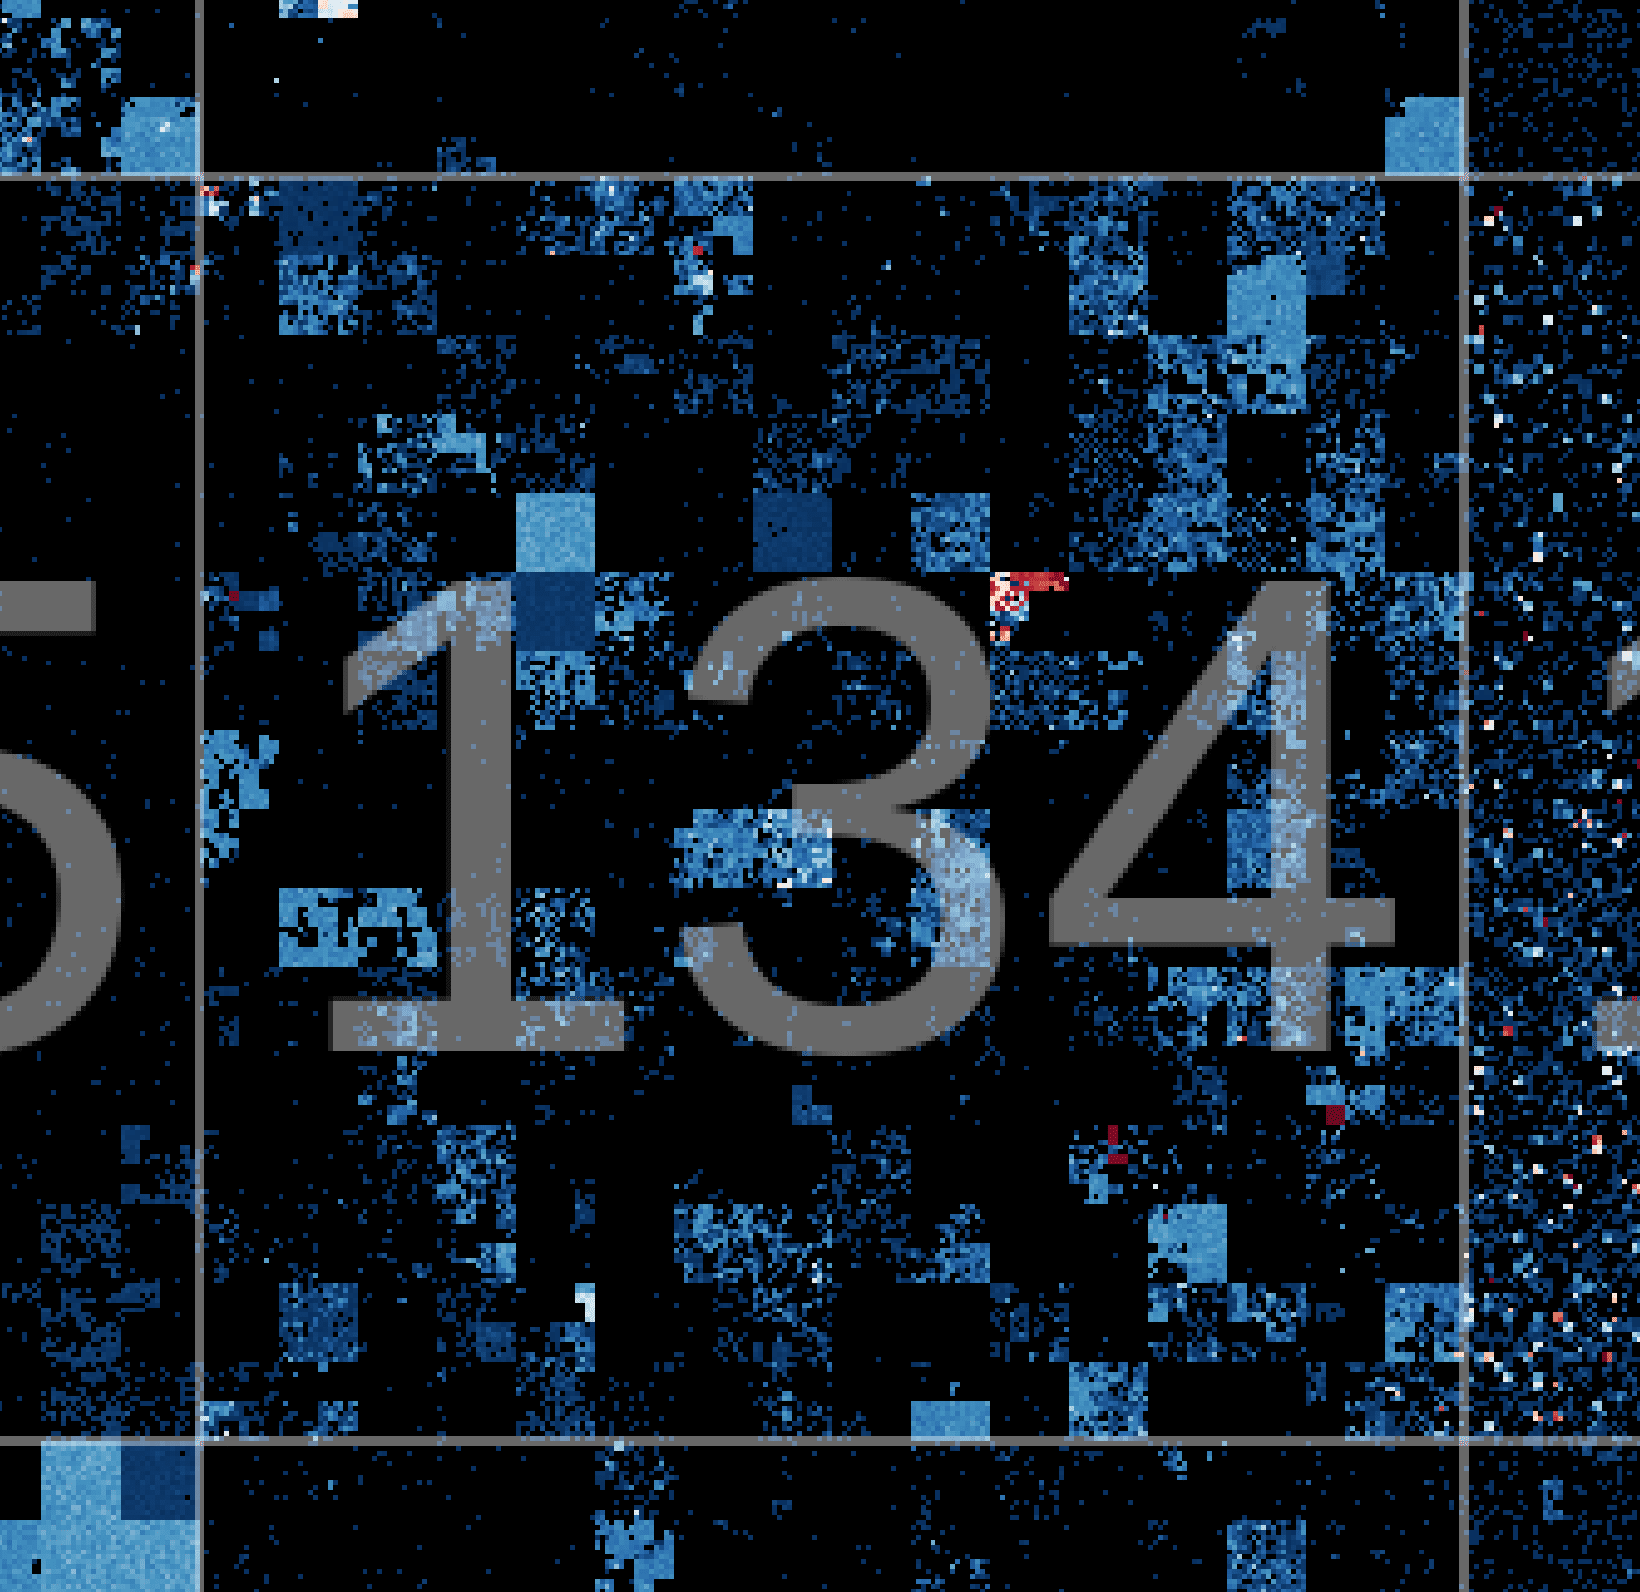
The command above generates the image found at the top of this post. Hilbertcurves are a powerful projection used to render IPv4 address space. The outputis rather compact and the way adjacent IP space is plotted, CIDR blocks arerepresented as rectangles. It takes a bit of getting used to at first, the waynumbers meander around the image. Once you get the hang of however, it becomesintuitive. The excerpt below shows a zoom in on
134.0.0.0/8
the inner squareseach represent /16s. Each pixel represents a /24. Black pixels had zero IPaddresses in that /24. Blue to white blocks are < 50% in use and white to redblocks are > 50% with red being 100% represented.

Ben April is the Research Director for Farsight Security, Inc


