DomainTools App for Elastic
Jump to Section
Overview
The DomainTools App for Elastic is an out-of-the-box solution that provides direct access to DomainTools’ industry-leading threat intelligence data within Elastic. Furthermore, the DomainTools App complements the functionality of the Elastic SIEM app significantly, although it is not dependent on the SEIM app. Elastic customers who are using the ELK (ElasticSearch, LogStash, Kibana) stack for security incident response and threat hunting can use the new app to enhance the value of their operations and analysis.
Elastic users using this app will benefit from:
- Increased visibility to DNS events and the ability to proactively flag risky domain names
- Precisely targeted threat hunting activities using DomainTools analytics
- Real-time enrichment of domain intelligence in Elastic indexes
- Adhoc domain investigations from within Kibana UI
- Flagging of domains tagged in DomainTools Iris within Elastic
Deploying DomainTools App
Prerequisites
Elastic Version
The App has been successfully validated in the following Elastic versions:
- Elastic 7.5.2
DomainTools API Key
You will need a DomainTools Enterprise API username and API key to complete the app setup. DomainTools typically provides access to obtain the API credentials by creating an account for the primary point of contact in your organization.
Your API account must have access to the below listed API endpoints:
- Iris Investigate
- Iris Enrich
The app cannot be configured without access to these endpoints. If you need to obtain new API keys to evaluate the app, contact us via email at [email protected] and we will assist you.
Download the DomainTools App
The DomainTools App has multiple components and the latest version of each can be downloaded from the following locations:
- Github – https://github.com/DomainTools/elastic-integration
- Docker Hub – https://hub.docker.com/r/domaintools/elastic_integration
Elastic Common Schema (ECS)
The DomainTools App leverages the Elastic Common Schema (ECS) for extensibility. ECS is an open-source specification, developed with support from the Elastic user community. ECS defines a common set of fields to be used when storing event data in Elasticsearch, such as logs and metrics.
Currently, the app does not support custom data models.
LogSources
The DomainTools App extracts domain names from your proxy logs, DNS logs, or a similar data source that contains domain names. To enable this, one needs to first identify data sources that contain URLs (web links) or hostnames representing communication from your network to the public Internet. In most cases, web proxy logs provide the best visibility into these domains. The LogStash configurations can be then customized to monitor the specific log sources within our app.
We also recommend you to review the Release Notes of a specific version to be aware of the changes introduced. If you currently have an older version of the DomainTools App and intend to upgrade, you would need to uninstall currently installed components first.
Please contact DomainTools Support for assistance with installation/ upgrade of your app.
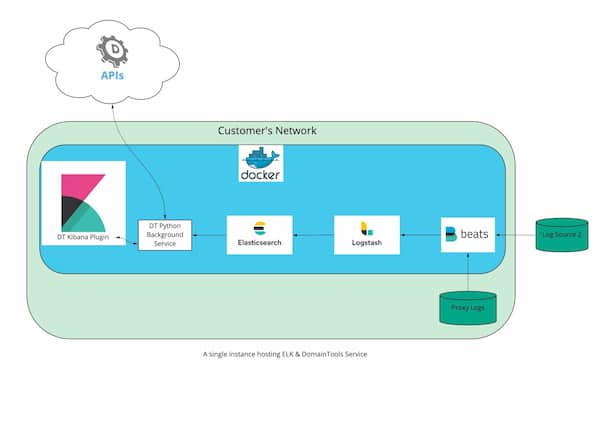
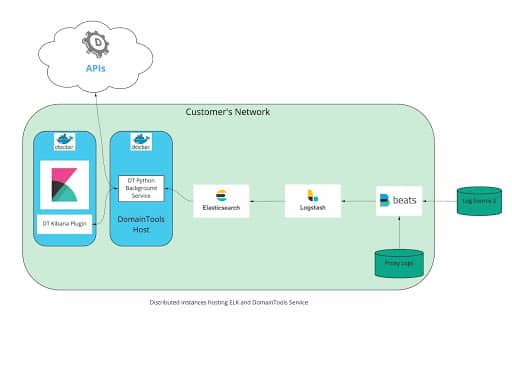
Deployment Scenarios
The DomainTools App supports the following deployment models meeting the most common enterprise setups. The app is designed to be best installed in a docker container for isolation.
You can find additional references to run Elastic on docker.
Installation Steps
- Installing the Backend Service
- Developer friendly notes are documented in our repository https://hub.docker.com/r/domaintools/elastic_integration
- Required applications on host that run the service container:
- Docker
- Docker Compose
- On the host, you wish to install the service
/bin/bash -c “$(curl -fsSL
https://github.com/DomainTools/elastic-integration/raw/main/install.sh)”
- You’ll need to ensure the backend service’s .env file is pointed to the correct elasticsearch host and has the correct credentials. You can make the change in the LOC identified below
https://github.com/DomainTools/elastic-integration/blob/main/.env.example#L2 - Make a note of the service URL (host IP address and port)
- The service URL is the IP address of the instance you are installing this service onto. Whether you use public or private IP will be determined by whether your Kibana and Elastic instances can hit this instance on the private IP.
- Default Port: 8000
- If you have another service utilizing 8000, then you can designate the desired port in https://github.com/DomainTools/elastic-integration/blob/main/docker-compose.customer.yml#L7
- Make a note of the port
- Installing the Kibana plugin
- On the Kibana host as Kibana user
- Assuming kibana-plugin binary is installed at /usr/share/kibana/bin/kibana-plugin
/usr/share/kibana/bin/kibana-plugin install
https://github.com/DomainTools/elastic-integration/raw/main/domaintools7.5.2-1.0.6.zip
- You’ll need to ensure the Kibana plugin is pointed to the backend service host via the Service URL & Port identified while configuring the Backend Service (see above)
- This can be done by navigating to the DomainTools App → Settings → ‘Configure App’
- App defaults to http://localhost:8000 . Change to your environment-specific value.
- Configuring Logstash
Logstash needs to be configured with the log sources from which DNS events will be enriched. Below are couple of examples on how you can configure Logstash
Configuration Steps
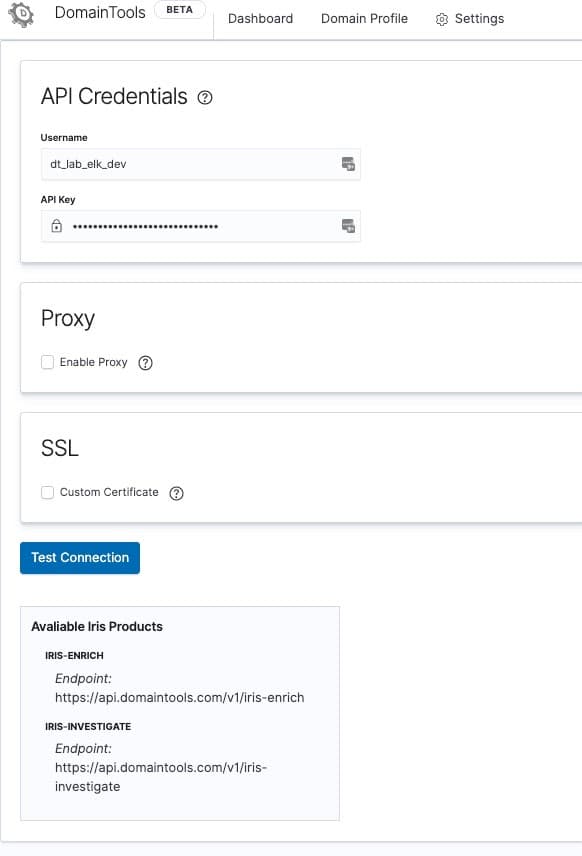
- Configure API
- In Kibana, go to DomainTools App -> Settings -> Configure API
- Enter your API Username and Key
- Test Connection
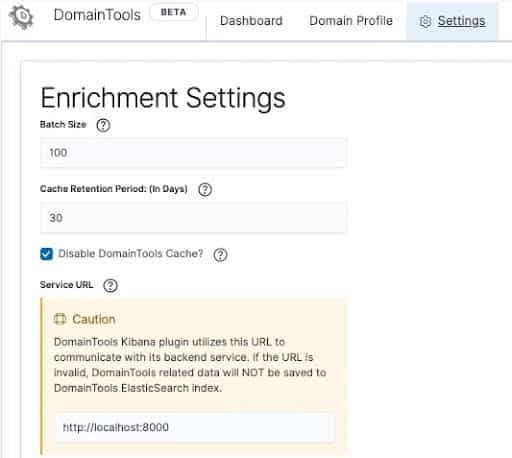
- Configure Enrichment
- In Kibana, go to DomainTools App -> Settings -> Configure App
- If you have not configured LogStash, please do so before proceeding further.
- Review the default, and make changes to the enrichment schedule
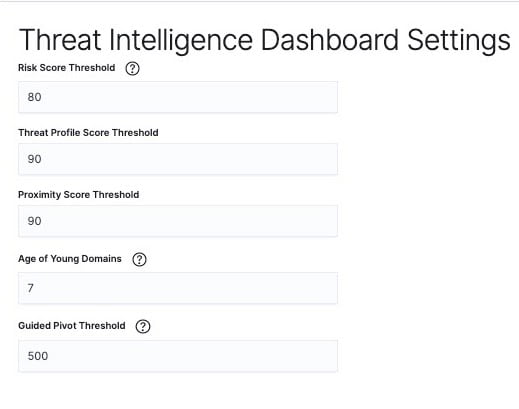
- Adjust the threshold for DomainTools scores, young domains, and guided pivots. The app is already populated with default values for your convenience. These values are used to flag risky domains in your dashboards.
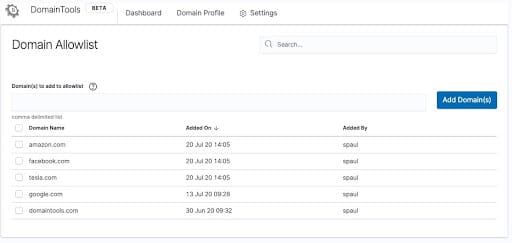
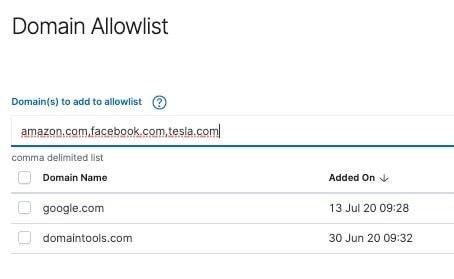
- Configure Allowlist
- In Kibana, go to DomainTools App -> Settings -> Configure Allowlist
- Add a concatenated list of up to 100 domains in SLD.TLD format (e.g. domaintools.com)
Key App Functionalities
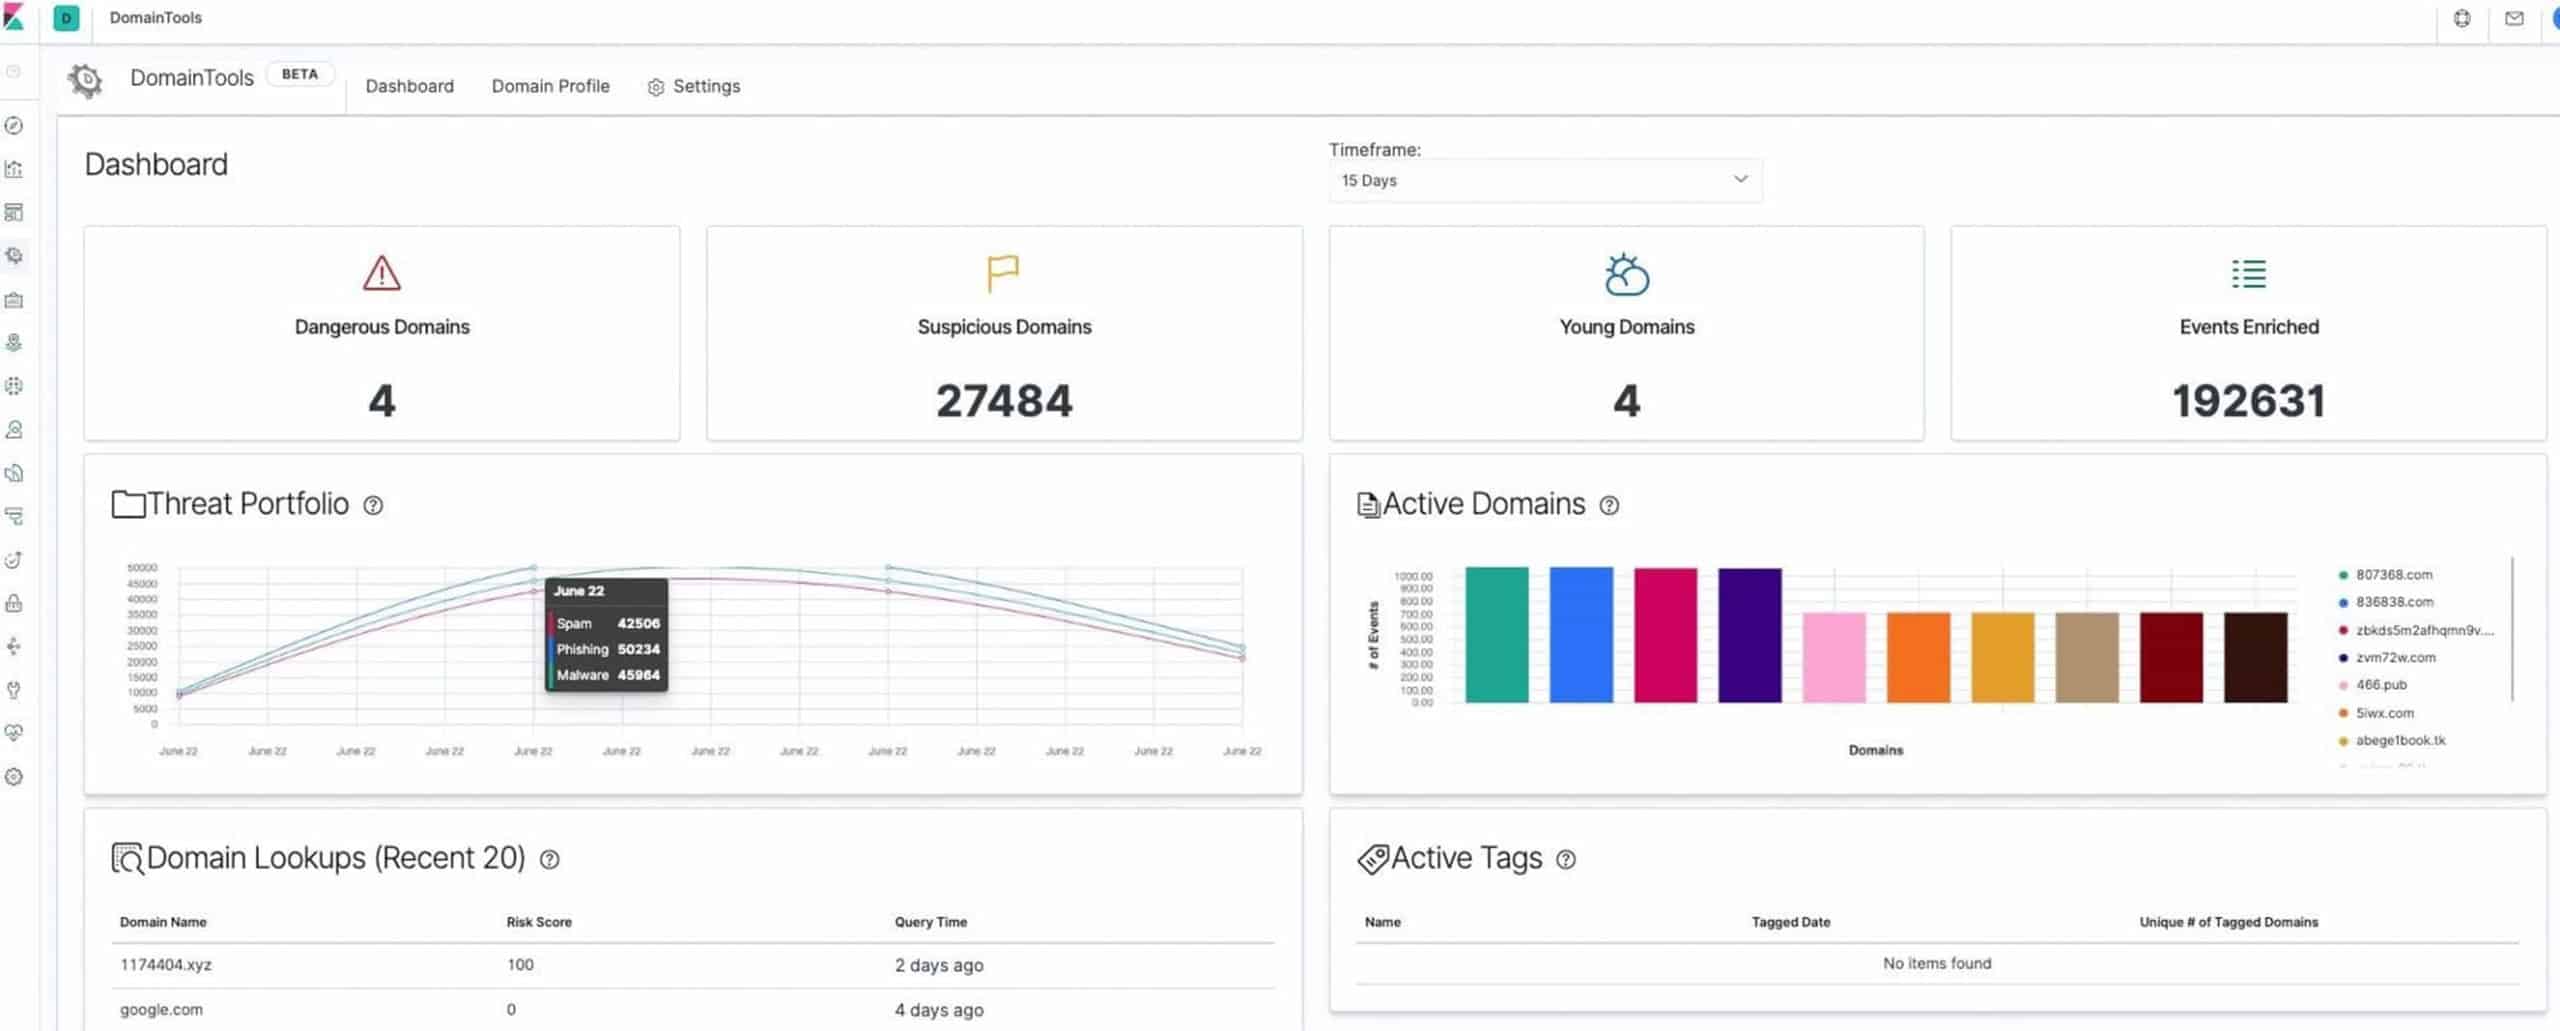
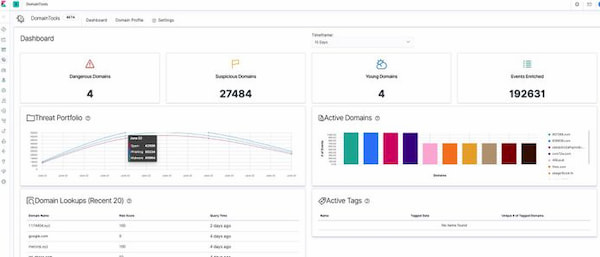
Threat Intel Dashboard
This dashboard is designed to help organizations gain quick situational awareness of the risk presented by domains observed on their network. The dashboard also helps guide teams to effectively leverage DomainTools data in their SOC workflows, with drill-downs that expose the underlying events.
The dashboard is powered by DomainTools Risk Score, a proprietary scoring algorithm that proactively identifies domains likely registered with malicious intent before they are weaponized. The technology is based on machine learning algorithms applied to DomainTools’ unparalleled coverage of domain name features and infrastructure characteristics.
Domain Profile
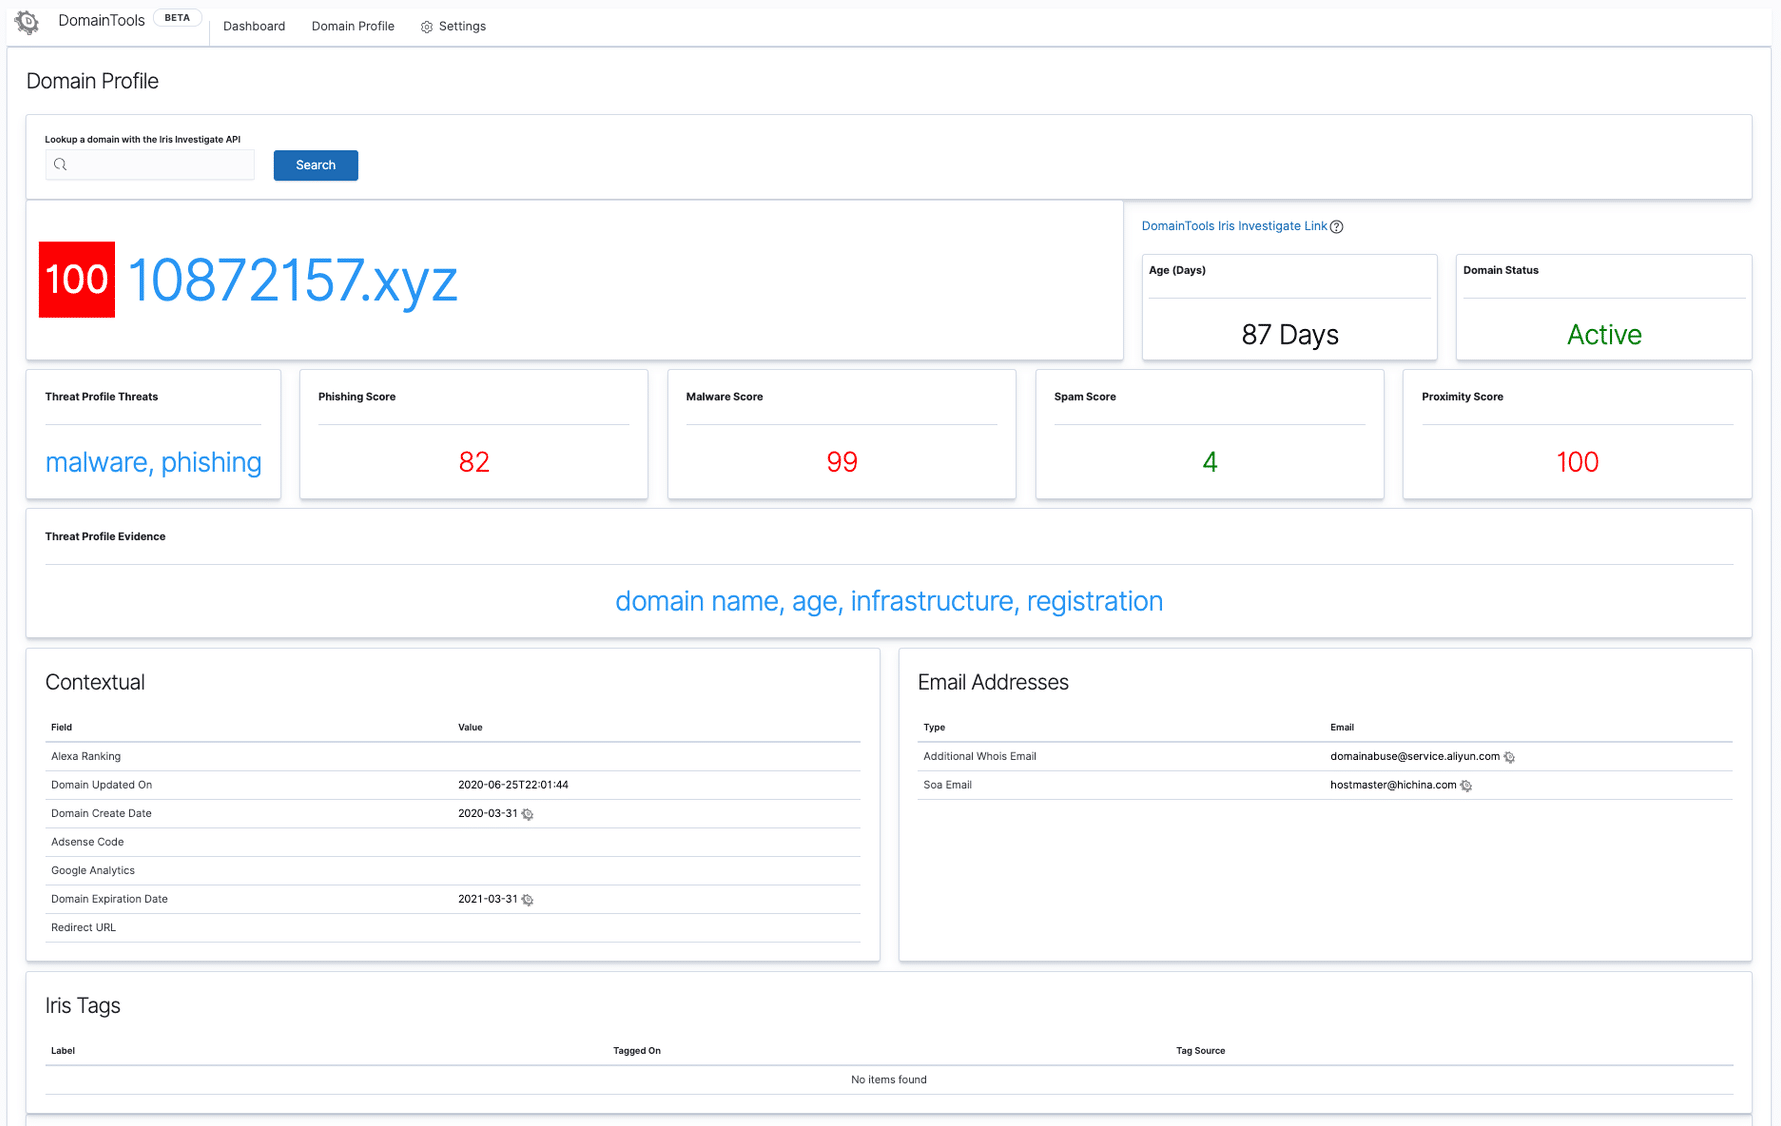
The Domain Profile page allows Elastic users to perform an ad-hoc lookup of a single domain observable from inside Kibana. An extensive set of Iris intelligence data is presented to the user with the additional context of Iris Guided Pivots (connected infrastructu
re intelligence) which can further progress your investigations.
Lastly, the app also discovers any historic events from your environment which match the queried domain.
Maintain Trusted Domains within App
Users can now maintain a list of trusted domains within the DomainTools App. All domains from this list are suppressed while detecting potentially malicious domains in the Threat Intel Dashboard.