Visualizing SIE Channel 204 Rdata


1. Introduction
Farsight Security, Inc.’s Security Information Exchange continually distributes a variety of real-time security data.
One such dataset is “de-duplicated/filtered/verified” passive DNS data, as distributed on Channel 204. A typical observation from Channel 204 might look like:
$ nmsgtool -C ch204 -o - -c 1
[Channel 204 header omitted here]
type: INSERTION
count: 1
time_first: 2016-09-12 09:48:26
time_last: 2016-09-12 09:48:26
response_ip: [omitted]
bailiwick: cto39.ru.
rrname: cto39.ru.
rrclass: IN (1)
rrtype: A (1)
rrttl: 3600
rdata: 88.198.154.20
Assume we’re particularly interested in the rdata values (shown bolded above).
If we were to bin the observed rdata values by their “first octet” over a period of time, what might that distribution look like? Are there some /8’s that are particularly busy? Other /8’s that basically see little or nothing?
We can collect some data from an SIE blade server by saying:
$ nmsgtool  -C ch204  -c 1000000  -o -  | \
grep rdata |  sed 's/^rdata: //' | awk -F. '{print $1}' |  \
grep -o '[0-9]*' | sed '/.\{4\}/d' \
> a-million-ch204-first-octets.txt
We can then post-process that data by saying:
$ cat a-million-ch204-first-octets.txt | \
awk '($1 < 256)' | sed "s/^0*\([1-9]\)/\1/;s/^0*$/0/" | \
sort -n | uniq -c > a-million-ch204-first-octets-uniqed.txt
The start of the a-million-ch204-first-octets-uniqued.txt looks like the following, where the first column is the number of observations in that /8, and the second column is the number of the /8 (e.g., 0/8, 1/8, etc.):
$ head -10 a-million-ch204-first-octets-uniqed.txt
71243 0
342094 1
278596 2
148476 3
76369 4
80079 5
61161 6
43521 7
59980 8
27007 9
38951 10
[etc]
Importing that data into Excel and creating a bar chart, we might see a distribution that looks like the following, with the first octet running along the X axis from 0 to 255, and the Y axis being the number of hits for each octet, shown using log-linear axes.
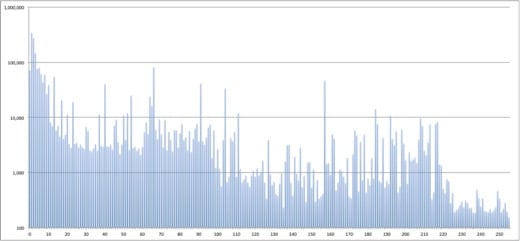
That’s one sample distribution.
If we were to draw a new batch of observations, what would that set look like? (Presumably it would not be exactly the same as our sample)
What if we were to look at one sample after another? Would there be some “first octets” that are consistently “hot”? Or will the rdata “first octet” counts jump around “all over the place?”
To find out, let’s create a graphic that shows a “row of pixels” for each time slice of data. There will be 256 pixels in each row, each pixel representing one of our first octet counts. The first pixel will represent the count for 0/8, the second pixel will represent the count for 1/8, the third pixel will represent the count for 2/8, and so on, with the last pixel representing the count for 255/8.
Low activity pixels will be dim, while high activity pixels will be bright, drawing attention to the hot /8’s.
While this graphic is just meant to be an exploratory tool to help us gain insight into the data, and most of the insight will come from just looking at the graph, we also want to be able to roll the cursor over the graph to see the value associated with any given pixel of interest.
2. Choice of Graphical Toolkits
There are many different graphical toolkits one could use to generate a visualization of the sort we wanted. We discuss some of them in Appendix 3 to this article (“A Short Selective Tour of Graphical Toolkits (By Way of Examples)”). For this article we arbitrarily selected SFML, the “Simple and Fast Multimedia Library“.
For the purpose of this article, we’ll also assume that we’re using SFML on a Mac with the normal free Apple Developer Tools (including the Developer Command Line Tools) and HomeBrew installed.
Installation of SFML 2.4 itself is easy, with Brew installed, simply say:
$ brew install sfml
3. Collecting Some Ch204 Data To Visualize
Now we need some data. While there are many ways we could grab that data, let’s use SIE Remote Access to collect 120 chunks of data with 2,500 records/chunk.
We create an encrypted tunnel to SIE from an authorized host by saying:
$ sratunnel -s 'tls:srausername@sraserver,1021'  \
-c 204  -w ch=204  -o nmsg:udp:127.0.0.1,8000 &
We can then run a little bash script that looks like:
$ cat collect-data.sh#!/bin/sh
n=0
max=120
while [ $n -lt $max ]
do
nmsgtool -l 127.0.0.1/8000 -c 2500 | grep "rdata: " | \
awk '{print $2}' | grep -v '["a-zA-Z:\]' | grep "\." | \
awk -F. '{print $1}' | sort | uniq -c | \
awk '{print $2 " " $1}' | sort -n | \
awk '($1 >= 0) && ($1 <= 255) && ($2 >= 0) && ($2 <= 2500)'
true $(( n=n+1 ))
done
by saying:
$ sh collect-data.sh > ch204-data.txt
That job takes only a minute or two to run, leaving us with our data file:
$ wc -l ch204-data.txt
   16161 ch204-data.txt
The records in that file look like:
$ more ch204-data.txt
5 9
8 26
10 1
12 1
14 1
17 40
23 57
27 4
31 2
[etc]
Since we’re done with our SRA encrypted tunnel, bring it to the foreground, and kill it with a ctrl-C:
$ fg
ctrl-C
4. Visualization Scheme
Ultimately we want a graphical window with 256 columns and 100 rows.
To avoid ending up with a too-tiny graphic, we’ll make each of the “pixels” in that matrix actually 8×8 pixels.
While SFML includes classes for drawing simple shapes, including rectangles, because we’re making a LOT of rectangles, we’re going to create a vertex array of quads instead (see the performance discussion athttp://www.sfml-dev.org/tutorials/2.4/graphics-vertex-array.php).
We’ll color each of those rectangles according to that pixel’s associated count. Grey scale would work for that purpose, going from white to black, but let’s be a little more colorful and adjust the saturation in a Hue/Saturation/Value (HSV) color model to represent our counts instead.
The code we ended up with can be seen in Appendix 1. (Obviously this is not polished elegant code, but maybe my ugly code will encourage someone in the audience to rewrite this more beautifully :-) )
A Makefile is also convenient for building the code. One is provided in Appendix 2.
Building the code (once SFML has been installed with Brew) is just a matter of saying
$ make
That compiles and links the code with the required libraries.To actually run the sample code, simply say:
$ ./sfml-test-4
Note the dot and slash in front of sfml-test-4
A window will then appear on your screen, perhaps looking something like:
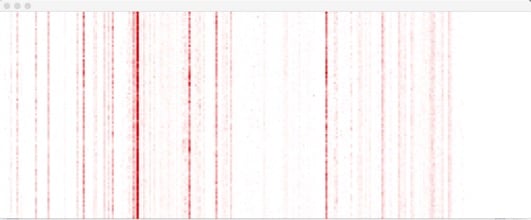
If you mouse over the graph, you’ll see the value under your mouse pointer reported in the window from which you launched the application. For example, if we mouse over the hot red line we see:
Time slice 6: Netblock 66/8 --> Count=188

Time slice 7: Netblock 66/8 --> Count=282

Time slice 8: Netblock 66/8 --> Count=221
To kill the window, click the “red X” in the upper left hand corner, or hit ctrl-C in the window from which you launched the app.
5. Going Further
This has just been a simple example visualization. There’s obviously a lot more that could be done to enhance this simple proof of concept, including:
- Rather than using a shell script to capture static data from an SRA tunnel, plumb the program directly into the SIE tunnel’s data stream
- Instead of simply displaying a fixed number of rows, create a real-time scrolling display
- Allow selection of a subset of columns (rather than showing all 256 by default), and allow the window to be scaled up or down
- Offer the ability to tailor the color model employed
What else can you come up with to enhance and improve this simple example?
Appendix 1. sfml-test-4.cpp
#include <cmath>
#include <SFML/Graphics.hpp>

/* -
following hsv_to_rsb code adapted from a comment near the bottom of http://stackoverflow.com/questions/3018313/algorithm-to-convert-rgb-to-hsv-and-hsv-to-rgb-in-range-0-255-for-both
*/

float clip(float n, float lower, float upper) {
  return std::max(lower, std::min(n, upper));
}

void hsv_to_rgb (float h, float s, float v, int *r_r, int *r_g, int *r_b) {

  if (h > 360)
    h -= 360;
  if (h < 0)
    h += 360;

  h = clip(h, 0, 360);
  s = clip(s, 0, 1);
  v = clip(v, 0, 1);

  float c = v * s;
  float x = c * (1 - std::abs (fmod ((h / 60.0), 2) - 1));
  float m = v - c;
  float rp, gp, bp;
  int a = h / 60;

  switch (a) {
    case 0:
      rp = c;
      gp = x;
      bp = 0;
    break;

    case 1:
      rp = x;
      gp = c;
      bp = 0;
    break;

    case 2:
      rp = 0;
      gp = c;
      bp = x;
    break;

    case 3:
      rp = 0;
      gp = x;
      bp = c;
    break;

    case 4:
      rp = x;
      gp = 0;
      bp = c;
    break;

    default: // case 5:
      rp = c;
      gp = 0;
      bp = x;
    break;
  }

  *r_r = (rp + m) * 255;
  *r_g = (gp + m) * 255;
  *r_b = (bp + m) * 255;

}


/* --- */

using namespace sf;

int main()
{

int x, y;
int val;
int i, j, ii, jj;
int thedisplayrow, thedisplaycol, lastcol;
int cell, thecell;

float myhsv_h, myhsv_s, myhsv_v;
int myrgb_r, myrgb_g, myrgb_b;

FILE * myfile;

// size of displayed "blobs" - 8x8 (still looks tiny at higher resolution)
const int delta_x=8;
const int delta_y=delta_x;

// size of working "screen" in "blobs"
// cols must stay at 256 givein the range of first octet values in IPv4 addrs
// rows can be set to suit the available screen real estate
const int cols=256;
const int rows=100;

// first blob loc (zero origin values); Cartesian coords with flipped Y axis
// so that the max (x,y) value is in the bottom right corner of the screen
x=0;
y=0;

// width of each row in actual pixels
// each row will have col cells, each delta_x wide
const int row_width=cols*delta_x;

// height of window in actual pixels
// the display will "rows" number of rows, each delta_y tall
const int number_of_rows=rows*delta_y;

// our main window
RenderWindow window(VideoMode(row_width,number_of_rows,32)," ");

// vectors of actual values
int actual_values[row_width*number_of_rows];

// our main data structure, holds the verticies of the cells to be displayed
// the 4 represents the number of verticies per quad
// NOTE: this is not the full width of the rows or the actual number of rows!
VertexArray quad(Quads, (rows*cols*4));

// ensure starting lastcol value will be less than initial i
lastcol=-1;

i=0;   			// x "coordinate" as read from the data file
			     // need not be sequential, e.g., may have "gaps"

j=0;   			// y "coordinate," incremented when i <= previous i

cell=0;			// incremented, by 4's, through the array of verticies

myfile = fopen ("ch204-data.txt","r");
if (myfile == NULL) { perror("Failed: "); return 1; }

for (ii=0; ii<=(row_width*number_of_rows); ii++){
	actual_values[ii]=0;
}

while ((fscanf (myfile, "%d %d", &i, &val) != EOF) && (j<rows))
   {

   x=i*delta_x;
   y=j*delta_y;

   // set the coordinates of the rectangle
   // lower left hand corner
   quad[cell].position =   Vector2f(x,y);
   // upper left hand corner
   quad[cell+1].position = Vector2f(x,y+delta_y);
   // upper right hand corner
   quad[cell+2].position = Vector2f(x+delta_x, y+delta_y);
   // lower right hand corner
   quad[cell+3].position = Vector2f(x+delta_x, y);

   // Hue, Saturation, Value Color Model (see
   // https://en.wikipedia.org/wiki/HSL_and_HSV )

   // www.rapidtables.com/convert/color/hsv-to-rgb.htm for color value tests

   myhsv_h=((float) 360.0);
   myhsv_s=(float) val/256.0;
   myhsv_v=((float) 1.0);

   // convert hsv to RGB since that's what SFML needs
   hsv_to_rgb (myhsv_h, myhsv_s, myhsv_v, &myrgb_r, &myrgb_g, &myrgb_b);

   // need to set the color of *all four* vertices to set the cell's color
   quad[cell].color =   Color::Color((uint8_t) myrgb_r, (uint8_t) myrgb_g,
       (uint8_t) myrgb_b, (uint8_t) 255);
   quad[cell+1].color = quad[cell].color;
   quad[cell+2].color = quad[cell].color;
   quad[cell+3].color = quad[cell].color;

   // save the value for later retrieval
   for (jj=y; jj<(y+delta_y); jj++) {
      for (ii=x; ii<(x+delta_x); ii++) {
	 actual_values[ii+(jj*row_width)]=val; } }

   // move forward 4 to be set for the next set of verticies
   cell=cell+4;

   if (i <= lastcol) {
      // if the index has a lower value (*or* the same value)
      // we're starting a new row
      j=j+1;

      if (j > rows) { /* full display */
          goto display_the_data; }
   }
   lastcol=i;
}

display_the_data:; // *******************************************

window.clear(Color::White);
window.draw(quad);
window.display();

while (window.isOpen())
   {
      Event event;
      int mouse_position_x;
      int mouse_position_y;

       while (window.pollEvent(event))
          {
             switch (event.type)
                {
		case Event::Closed:
			window.close();
                	break;

		case Event::MouseMoved:

			mouse_position_x=event.mouseMove.x;
			mouse_position_y=event.mouseMove.y;
			// map screen coordinates to a cell's address
			thedisplayrow=(int)(mouse_position_y / delta_y);
			thedisplaycol=(int)(mouse_position_x / delta_x);
			fprintf(stderr, "Time slice %d: Netblock %d/8 --> ",
			   thedisplayrow, thedisplaycol);
		        thecell=mouse_position_x+(mouse_position_y*row_width);
			fprintf(stderr,"Count=%d\n\n", actual_values[thecell]);
                        break;

		default:
                break;
	    }
       }
    }
    return 0;
}
Appendix 2. Makefile
$ cat Makefile
CPPFLAGS = -g -Wall -Wunused
INCLUDES = -I/usr/local/Cellar/sfml/2.4.0/include
LDFLAGS = -L/usr/local/Cellar/sfml/2.4.0/lib \
          -lsfml-system -lsfml-graphics -lsfml-window

all:
	$ g++ $(CPPFLAGS) -o sfml-test-4 sfml-test-4.cpp $(INCLUDES) $(LDFLAGS)

clean:
	rm -f sfml-test-4
Appendix 3. A Short Selective Tour Of Some Graphic Toolkits (By Way Of Examples)
Introduction
The Challenge: If you write code but you’re not an experienced Mac OS X or iOS developer, the process of developing data-driven graphics under OS X with Xcode and Objective-C or Swift may appear daunting — particularly if you’re not already fluent in Objective-C or Swift.
So can we do data-driven graphics on the Mac without having to use Xcode, Objective-C, or Swift? Yes. This Appendix explores some of the options available to you as a programmer, other than SFML, as used for this post’s example code.
Why? Why might someone strive to avoid using Xcode, Objective-C, and/or Swift? There may be many potential reasons, including:
- No desire to learn yet another programming language/deep attachment to some other language
- A dislike for object-oriented programming paradigms generally
- A desire to write code that can run on Mac OS X and in other environments (Linux, Windows, etc.)
- Frustration with the many Internet “learning Xcode” and “Xcode tutorials” that have not been kept pace with Xcode as it evolves (and becomes more and more complex), or
- A simple dislike for GUI IDEs (integrated development environments) and the stunning complexity they often mask
With that for context, our general goal is to identify and demonstrate solutions which:
- Use only free/open-source software
- Work on the Mac, but preferably also on multiple other platforms
- Are callable from gcc or g++, but preferably also readily callable from other languages, too
- Are able (at a minimum) to programmatically generate arbitrarily-shaded rectangles at specified locations
Solutions Described in This Appendix:
- GDLib
- X11
- cv
- Java with Swing
When considering possibilities such as these, one of the biggest obstacles is just getting a basic example to build and run. If you have a basic starting point, going beyond that is often just a matter of iterative improvement.
Therefore, we’re providing a simple example for each of the four solutions we considered, besides SFML (which we used in the actual main blog post).
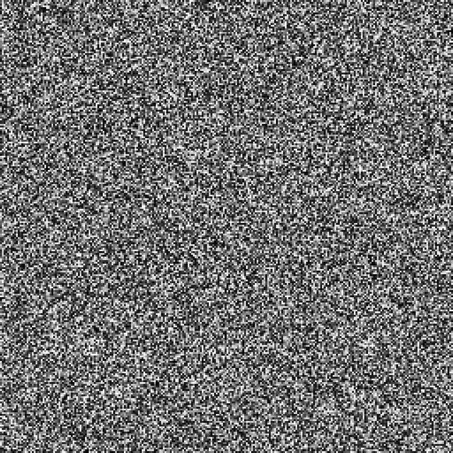
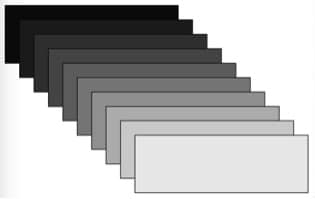
1) Salt-and-Pepper: 1280×1280 JPEG of Random Greyscale 5×5 Pixels Using GDLib
Package home:   https://libgd.github.io/
Installing:     $ brew install libgd
Building:       $ gcc -Wall -o display2 display2.c -lgd -ljpeg
display.c follows:
#include "gd.h"
#include <stdio.h>

int main() {
  gdImagePtr im;
  FILE *jpegout;
  int i, j, startx, starty, stopx, stopy, pixelsize, myindex;
  int palette[255];
  int white;

  im = gdImageCreate(1280,1280);
  white = gdImageColorAllocate(im,255,255,255);
  gdImageFilledRectangle(im, 0, 0, 1279, 1279, white);
  pixelsize=5;

  for (i = 0; i <= 255; i++) {
      palette[i] = gdImageColorAllocate(im, i, i, i);
  }
  srand(568);                                     /* arbitrary seed */
  for (j = 0; j <= 255; j++) {
     for (i = 0; i <= 255; i++) {
        myindex= (int)(drand48()*256);
        startx=i*pixelsize;
        starty=j*pixelsize;
        stopx=(i+1)*pixelsize;
        stopy=(j+1)*pixelsize;
        gdImageFilledRectangle(im, startx, starty, stopx, stopy,
           palette[myindex]);
        }
   }

  jpegout = fopen("test.jpg", "wb+");
  gdImageJpeg(im, jpegout, -1);
  fclose(jpegout);
  gdImageDestroy(im);
}
$ gcc -o display2 display2.c -lgd -ljpeg
$ ./display2
[view test.jpg with your favorite image viewer]
Sample Output (test.jpg), as displayed by the Preview App on a Mac:
2) Overlaid Grey Rectangles Using X11
Package home:    https://www.xquartz.org/
Installing:      Double-click Mac .dmg file from the above web site
Note:            Check to make sure that Xquartz --> Preferences --> Output --> Colors: Millions
Building:        $ gcc -Wall hello-x.c -L/usr/X11R6/lib -lX11 -I/opt/X11/include -o hello-x
hello-x.c follows:
#include <X11/Xlib.h>
#include <stdio.h>
#include <stdlib.h>
#include <string.h>

int main(void) {
   Display *d;    	/* Display */
   int s;         		/* Screen */
   Window w;      	/* Window */
   GC gc;         		/* Graphic Context */
   Visual *v;     		/* X11 Visual */
   XEvent e;      		/* event */
   char *windowname;
   Colormap cmap;
   XColor xcolor;
   unsigned long black, white;
   int depth;
   int step, loopthrough;
   int x, y, height, width;

   /* get the display name from the DISPLAY environment variable */
   char *display_name = getenv("DISPLAY");

   /* Open the X Windows Display (e.g., xquartz on the Max) */
   d = XOpenDisplay(display_name);
   if (d == NULL) { fprintf(stderr, "Error: Cannot open display\nxquartz not installed or running?\n");
      exit(1); }

   /* Get the default screen number from the display we've opened */
   s = DefaultScreen(d);

   /* Get the default visual type for the specified screen (e.g.,
      normally we'll have "True Color" on modern hardware) */
   v = DefaultVisual(d,s);

   /* Get the default display depth (should be 24) */
   depth = DefaultDepth(d,s);
   if ( depth ^= 24) { fprintf(stderr,
      "Error: requires 24-bit X Windows display\nDoes xquartz need to be set to use millions of colors?\n"); exit(1);
      }

   /* define convenience color symbols */
   black=BlackPixel(d,s);
   white=WhitePixel(d,s);

   /* open a white 512x512 window */
   w = XCreateSimpleWindow(d, RootWindow(d,s), 0, 0, 512, 512,
       1, black, white);

   /* label the window */
   windowname="Grey Rectangles";
   XStoreName(d, w, windowname);

   /* create a graphic context */
   gc = XCreateGC(d,w,0,0);

   /* create the TrueColor colormap */
   cmap = XCreateColormap(d,w,v,AllocNone);
   XSetWindowColormap(d,w,cmap);

   /* have the main event loop pay attention to exposures, key presses and
      button clicks */
   XSelectInput(d, w, ExposureMask | KeyPressMask | ButtonPressMask | PointerMotionMask);

   /* map the window */
   XMapWindow(d, w);

   /* set our window background to white by default */
   XSetBackground(d,gc,white);

   /* loop through ten times */
   for (loopthrough=0; loopthrough<10; loopthrough++ ) {

      /* look at all shades of black/grey/white */
      /* to get black/grey/white from RGB, set R=G=B */
      for (step=0; step <=255; step++ ) {
         /* set the RGB components */
         xcolor.red = (unsigned short) (step*256);
         xcolor.green = (unsigned short) (step*256);
         xcolor.blue = (unsigned short) (step*256);
         xcolor.flags = DoRed | DoGreen | DoBlue;

         /* get the color we want */
         XAllocColor(d, cmap, &xcolor);

         /* use that new color for the drawing we're about to do */
         XSetForeground(d,gc,xcolor.pixel);

         /* put a randomly size rectangle at a random location */
         x=(int) random()%512;
         y=(int) random()%512;
         width=(int) random()%128;
         height=(int) random()%128;
         XFillRectangle(d, w, gc, x, y, width, height);
         XFlush(d);
         }
         }

   /* wait for the user to do something; when they do, exit */
   while (1) {
      XNextEvent(d, &e);
      if ((e.type == KeyPress) || (e.type == ButtonPress))
         break;
         }

   /* clean up resources we no longer need */
   XFreeColormap(d,cmap);
   XFreeGC(d,gc);
   XDestroyWindow(d,w);
   XCloseDisplay(d);
   return 0;
   }
$ gcc -Wall hello-x.c -L/usr/X11R6/lib -lX11 -I/opt/X11/include -o hello-x
$ ./hello-x
Sample output captured with Grab on a Mac…
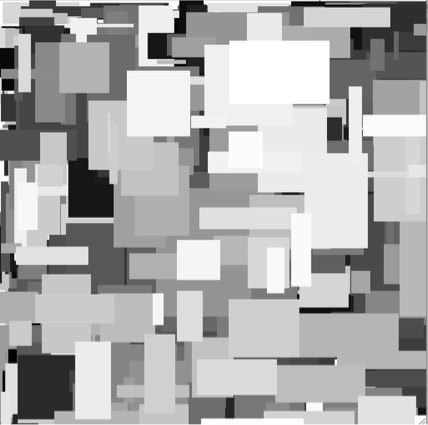
3) Cascading Greyscale Rectangles Using cv
Package home:    http://opencv.org/
Installing:      $ brew install homebrew/science/opencv3
                 $ brew ln opencv3 --force
Also needs:      $ brew install cmake
Building:        See below after the code snippet...
Note: Due to use of Cmake, ensure the following example is created and built in it’s own subdirectory. If you fail to do so, Cmake may accidentally attempt to include extraneous source files into this project.
$ mkdir cv-sample
$ cd cv-sample
drawing_1.cpp follows:
#include <opencv2/core.hpp>
#include <opencv2/imgproc.hpp>
#include <opencv2/highgui.hpp>
using namespace cv;
int main(void) {
  char my_window[] = "Sample Graphic";
  int myc,offset,startx,starty,endx,endy,width,height,increment,key;

  /* create a 547(x) x 345 (y) white window */
  /* NOTE: the Mat operator uses rows, columns NOT x, y! */
  /* CV_8UC3 ==> 8 bit, unsigned int, 3 channels */
  Mat my_image = Mat::zeros(345,547,CV_8UC3);

  /* fill the window with a white background */
  Mat roi (my_image, Rect(0,0,547,345));
  roi = Scalar(255,255,255);    /* white */

  /* draw a filled rectangle */
  myc=0; offset=10; width=300; height=100; startx=width; starty=height;

  /* (0,0) is in the upper left corner */
  for (increment=10; increment<=255; increment=increment+25) {
     myc=increment; startx=increment; starty=increment;
     endx=startx+width; endy=starty+height;
     rectangle(my_image,Point(startx,starty),Point(endx,endy),Scalar(myc,myc,myc),-1,8);
     /* Note, BGR, not RGB, for the color encoding */

     /* draw a 1 pixel black border around the rectangle */
     rectangle(my_image,Point(startx,starty),Point(endx,endy),Scalar(0,0,0),1,4);
  }

  imshow(my_window, my_image);

  /* click on window, then hit escape to close */
  while(1) {
     key = waitKey(200);
     if (key == 27) {
        destroyAllWindows();
        return(0);
     }
  }
}
$ cat CMakeLists.txt
cmake_minimum_required(VERSION 3.6)
project( cvDrawingDemo )
add_executable( drawing_1 drawing_1.cpp )
find_package( OpenCV 3 REQUIRED )
set(CMAKE_CXX_FLAGS "-Wall")
include_directories( ${OpenCV_INCLUDE_DIRS} )
target_link_libraries( drawing_1 ${OpenCV_LIBS} )
[remember, you MUST have the two files above in their own separate directory!]
$ Cmake . [note the space and the dot after Cmake!]
$ make
$ ./drawing_1
[click in window, then hit the escape key to close that window]
Sample output captured with Grab on a Mac…
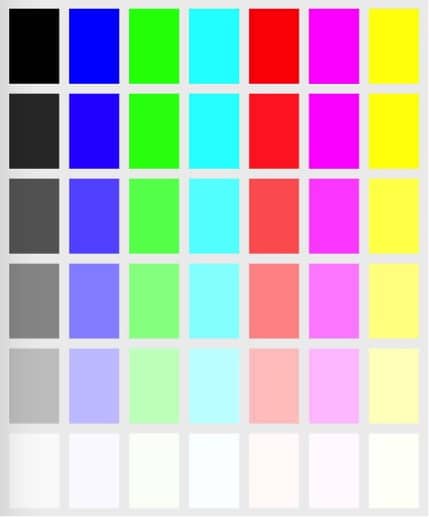
4) RGB Color Swatch Using Java and Swing
Package home:    http://www.oracle.com/technetwork/java/javase/downloads/index.html
Building:        $ javac MainClass.java
Executing:       $ java MainClass
MainClass.java follows:
import java.awt.Color;
import java.awt.Graphics;
import javax.swing.JFrame;
import javax.swing.JPanel;

public class MainClass extends JPanel {

  public static void main(String[] a) {
    JFrame f = new JFrame();
    f.setSize(430, 540);
    f.add(new MainClass());
    f.setDefaultCloseOperation(JFrame.EXIT_ON_CLOSE);
    f.setVisible(true); }

  public void paint(Graphics g) {

    Color c1;
    int cval, hoffset, voffset, width, height;
    int color1, color2, color3;
    width=50;
    height=75;

    for (int i=0; i<=5; i++) {
       for (int j=0; j<=7; j++) {
          cval=i*width;
          voffset=(i*(height+10))+10;
          hoffset=(j*(width+10))+10;

          color1=j/4;
          color2=(j-(4*color1))/2;
          color3=(j-(4*color1)-(2*color2));

          if (color1==1) { color1=255; } else { color1=cval; };
          if (color2==1) { color2=255; } else { color2=cval; };
          if (color3==1) { color3=255; } else { color3=cval; };

          c1 = new Color(color1,color2,color3);
          g.setColor(c1);
          g.fillRect (hoffset, voffset, width, height);
       }
    }
  }
}
$ javac MainClass.java
$ java MainClass
Sample output captured with Grab on a Mac…
This is not an exhaustive list of graphic options, and we do not mean to imply that these are the only options or even the best options for you to consider, they’re just examples of some possibilities.
Joe St Sauver, Ph.D. is a Scientist with Farsight Security, Inc.
Read more from DomainTools